Fed is now probably considering which is worse: a UST flash crash or a risky asset flash crash. Or both if they play their hand wrong.
Looking at the dynamics of the changes in the weekly Fed balance sheet, latest one released last night, a few things spring up which are concerning.
1.The rise in repos for a second week in a row – a very similar development to the March rise in repos (when UST10yr flashed crashed). The Fed’s buying of Treasuries is not enough to cope with the supply hitting the market, which means the private sector needs to pitch in more and more in the buying of USTs (which leads to repos up).
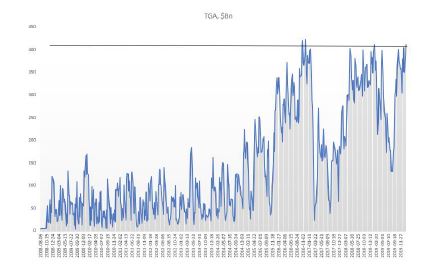
This also ties up with the extraordinarily rise in TGA (US Treasury stock-piling cash). But the build-up there to $1.4Tn is massive: US Treasury has almost double the cash it had planned to have as end of June! Bottom line is that the Fed/UST are ‘worried’ about the proper functioning of the UST market. Next week’s FOMC meeting is super important to gauge Fed’s sensitivity to this development
2.Net-net liquidity has been drained out of the system in the last two weeks despite the massive rise in the Fed balance sheet (because of the bigger rise in TGA). It is strange the Fed did not add to the CP facility this week and bought only $1Bn of corporate bonds ($33Bn the week before, the bulk of the purchases) – why?
Fed’s balance sheet has gone up by $3tn since the beginning of the Covid crisis, but only about half of that has gone in the banking system to improve liquidity. The other half has gone straight to the US Treasury, in its TGA account. That 50% liquidity drain was very similar throughout the Fed’s liquidity injection between Sept’19-Dec’19. And it was very much unlike QE 1,2,3, in which almost 90% of Fed liquidity went into the banking system. See here. Very different dynamics.
Bottom line is that the market is ‘mis-pricing’ equity risk, just like it did at the end of 2019, because it assumes the Fed is creating more liquidity than in practice, and in fact, financial conditions may already be tightening. This is independent of developments affecting equities on the back of the Covid crisis. But on top of that, the market is also mis-pricing UST risk because the internals of the UST market are deteriorating. This is on the back of all the supply hitting the market as a result of the Treasury programs for Covid assistance.
The US private sector is too busy buying risky assets at the expense of UST. Fed might think about addressing that ‘imbalance’ unless it wants to see another flash crash in UST. So, are we facing a flash crash in either risky assets or UST?
Ironically, but logically, the precariousness of the UST market should have a higher weight in the decision-making progress of the Fed/US Treasury than risky markets, especially as the latter are trading at ATH. The Fed can ‘afford’ a stumble/tumble in risky assets just to get through the supply in UST that is about to hit the market and before the US elections to please the Treasury. Simple game theory suggest they should actually ‘encourage’ an equity market correction, here and now. Perhaps that is why they did not buy any CP/credit this week?
The Fed is on a treadmill and the speed button has been ratcheted higher and higher, so the Fed cannot keep up. It’s a dilemma (UST supply vs risky assets) which they cannot easily resolve because now they are buying both. They could YCC but then they are risking the USD if foreigners decide to bail out of US assets. So, it becomes a trilemma. But that is another story.
There have been two dominant trends in the last four decades. The breakdown of the Bretton Woods Agreement in the early 1970s, the teachings of Milton Friedman, and the policies of Ronald Reagan, eventually ushered in the process of US financialization in the early 1980s. The burst of the Japan bubble in 1990, the Asian and EM financial crises of the mid-1990s, the dotcom bubble, and, finally, China’s entry into WTO in the early 2000s, brought in the era of globalization. This whole period has greatly benefited US, US financial assets and the US Dollar.
An unwind of these two trends of financialization and globalization is likely to have the opposite effect: causing US assets and the US dollar to underperform. From a pure flow perspective, going forward, foreigners are likely to invest less in the US, or may even start selling US assets outright. They are such a large player that their actions are bound to have a big effect on prices.
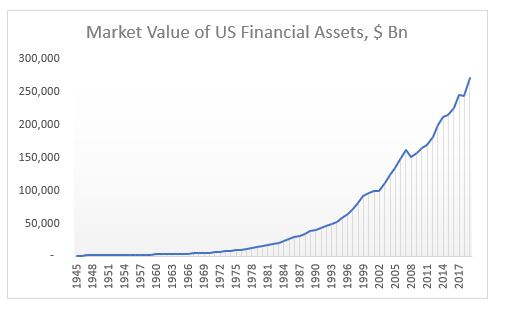
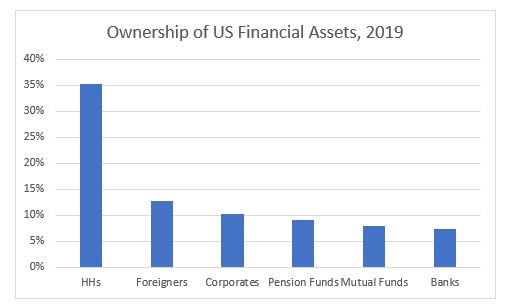
Foreigners have played an increasingly bigger role in US financial markets. In terms of ownership of US financial assets, if they were an ‘entity’ on its own, they would be the second largest holder of US financial assets in the US, after US households.
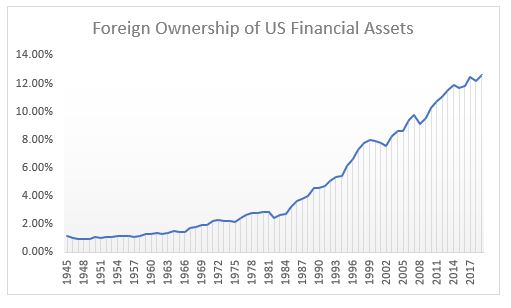
Foreigners owned about 2% of all US financial assets between 1945 and the 1980s. That number doubled between 1980 and 1990 and then tripled between 1990 and 2019!
As of the end of 2019, there were a total of $271Tn US financial assets by market value. Non-financial entities owned the majority, $129Tn, followed by the financial sector, $108Tn, and foreigners $34Tn.
The financial crisis of 2008 ushered in a period of financial banking regulation (on the back of the US authorities’ bail-out), which has slowly started to dismantle some of the structures built in the previous period starting in the 1980s. The Covid-19 pandemic and the resulting government bailout of the whole US financial industry, this time, are likely to intensify this regulation and spread it more broadly across all financial entities. As a result of that, there have been already calls to rethink the concept of shareholders primacy which had been a bedrock of US capitalism since the 1980s.
In addition, the withdrawal of the UK from the EU in 2016, followed shortly by the start of a withdrawal of the US from global affairs with the election of Donald Trump, ushered in the beginning of the process of de-globalization. The US-China trade war gave a green light for many companies to start shifting global supply chains away from China. The Covid-19 pandemic intensified this process, but instead of seeking a new and more appropriate location, companies are now reconsidering whether it might make sense to onshore everything.
What we are seeing is the winding down of these two dominant trends of the last 40 years: financialization and globalization. The effects globally will be profound, but I believe US financial assets are the most at risk given that they benefited the most in the previous status quo.
De-financialization is likely to reduce shareholder pay-outs (both buybacks and dividends) which have been at the core of US equities returns over the years. The authorities are also likely to start looking into corporate tax havens as a source of government cash drain in light of ever-increasing deficits. As a result, and as I have written before, I expect US equities to have negative returns (as of end of 2019*) for the next 5 years at least.
De-globalization is likely to reduce the flow of US dollars globally. Foreigners will have fewer USD outright to invest in US assets. Those, which are in need to repay USD debt, may have to sell US assets to generate the USDs. Indeed, the USD may strengthen at first but as US assets start to under-perform, the selling by foreigners will gather speed causing both asset prices as well as the USD to weaken further.
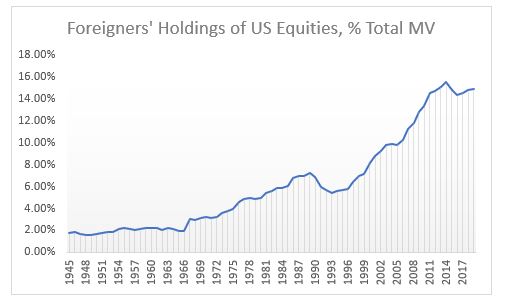
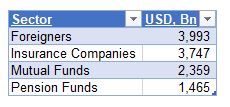
For example, foreigners are the third largest player in US equities, owning more than $8Tn as of the end of 2019. See below table for some of the largest holders.
As a percentage of market value, foreigners’ holdings peaked in 2014, but they are still almost double the level of the early 1990s and more than triple the level of the early 1980s. Last year, foreigners sold the most equities ever. Incidentally, HHs which have been a consistent seller of equities in the past, but especially since 2008, bought the most ever. Pension Funds and Mutual Funds, though, continued selling.
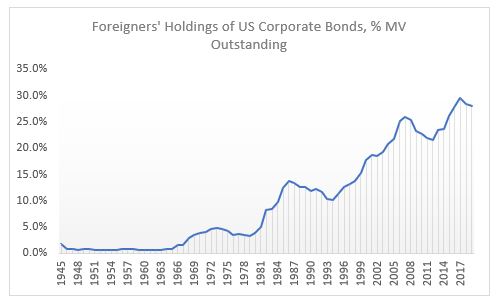
Foreigners are the largest holder of US corporate bonds, owning almost $4Tn as of end of 2019, more than ¼ of the market.
As a percentage of market value, foreigners’ holdings peaked in 2017, but they are still more than double the level of the early 1990s and 8x the level of the early 1980s.
Foreigners are also the largest holders of USTs, owning almost $6.7Tn as of end of 2019, more than 40% of the overall market.
As a percentage of market value, foreigners’ holdings peaked in 2008, at 57%! At today’s level, they are still about double the levels of the early 1990s and early 1980s.
There is a big risk in all these markets if the trends of the last four decades start reversing. US authorities are very much aware of the large influence foreigners have in US markets. The Fed’s swap and repo lines are not extended abroad just for ‘charity’, but primarily to ‘protect’ US markets from forced foreign selling in case they cannot roll their USD funding.
The UST Treasury market seems to be the most at risk here given the mountain of supply coming this and next year (multiple times larger than the previous record supply in 2008 – but foreigners back then were on a buying spree). The risk is not that there won’t be buyers, eventually, of USTs as US private sector is running a surplus plus the Fed is buying by the boatload, but that the primary auctions may not run as smoothly.
It was for this reason, I believe, that the authorities exempted USTs from the SLR for large US banks at the beginning of April. If that were not done, PDs might have been totally overwhelmed at primary auctions given the increased supply size, the fact that the Fed can’t bid and if foreigners start take up less. It is not clear, still, even with the relaxed regulation, how the primary auctions will go this year. We have to wait and see.
This is my reading of an excellent paper by S&P Global, “Examining Share Repurchasing and the S&P Buyback Indices in the U.S. Market” by Liyu Zeng and Priscilla Luk, March 2020.
Over the past 20 years (up to end of 2019), the S&P 500 Buyback Index had outperformed the S&P 500 in 16 out of 20 years, or about 5.5% per year. YTD, it has underperformed, though, by about 14%! With that it, has managed to erase the last 10 years of outperformance!
We had similar underperformance of the buyback index in the early stages of the last financial crisis, in 2007; while in 2009, the S&P 500 Buyback Index had a significant excess return. Make your own conclusions where we are in this cycle.
Reality is that “buybacks tend to follow the economic cycle with increased or decreased repurchase activities in up or down markets while dividend payouts are normally more stable over time, the S&P 500 Dividend Yield portfolio tends to outperform in down markets, while the S&P 500 Buyback Index may capture more upside momentum during bull markets.“
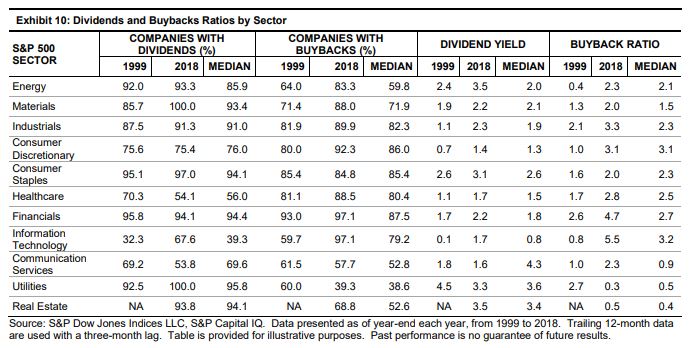
Almost all of tech, financial sector and consumer discretionary companies engage in share buybacks. Less than 50% of utilities do (but they all pay dividends). As share buybacks tend to congregate in cyclical rather than defensive sectors, the buyback index tends to underperform during recessions (this year).
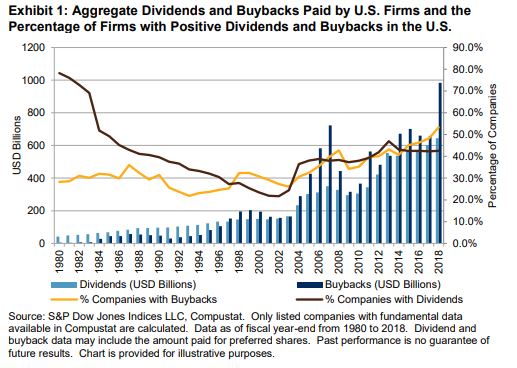
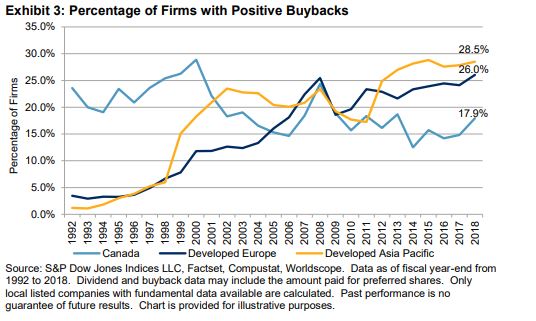
Since 1997, the total amount of buybacks has exceeded the cash dividends paid by U.S. firms. The proportion of dividend-paying companies decreased to 43% in 2018 from 78% in 1980, while the proportion of companies with share buybacks increased to 53% from 28%.
Compare to other developed markets. Despite an increase of share repurchases in Europe and Asia, as a % of all companies, buybacks still stand at about half that in the US. On the other hand, fewer Canadian companies engaged in share buybacks during that period.
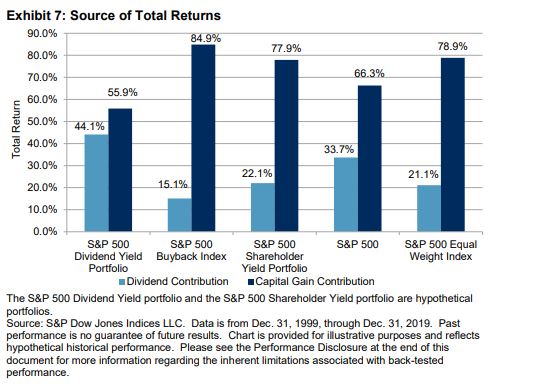
For the S&P 500 Index, over the last 20 years, 2/3 of the total return has come from capital gains and only 1/3 from dividends. Before the mid-1980s, when buybacks became dominant, the opposite was true. Buybacks have been instrumental in driving equity returns since the mid-1980s.
The response from the two most powerful central banks could not have been more different. ECB is innovative, using fine tuning and precision in tiered rates and targeted lending; Fed is still throwing the kitchen sink at the market by flooding the banking system with liquidity.
ECB is also going more direct partially because the banking system there is in shatters, but also because it makes sense regardless. Plus, the ECB is already taking credit risk by buying corporate bonds. Surely, the next step is literally direct credit lending and massively expanding the ECB counterparty list.
Fed is still stuck in the old model of credit transmission, entirely relying on the banking system. That model died in 2008, in fact, even before that, in the early 2000s, as the first Basel rules came into effect and the shadow banking system flourished.
Post 2008 it became much more common for financial institutions, like PE etc. to get in the credit loan business. Needless to say, this carries a big risk given that they don’t have access to Fed’s balance sheet like the banks.
The US banking system is now flooded with liquidity. If the new repo auctions are fully subscribed, this will double banks’ reserve balances and will bring them to the peak post the 2008 crisis. But do banks need that liquidity? It does not seem so: the first $500Bn repo auction yesterday had just $78Bn of demand. But that liquidity from the Fed is there on demand, plus the central banks swaps lines are open, and as of March 12, none has been drawn. And finally, the foreign reverse repos pool balance at the Fed has not shown any unusual activity (no drawdowns). All this is indicating that USD liquidity is at the moment sufficient, if not superfluous, so, it should have a negative effect on USD, given long USD has been a popular position post 2008.
All this liquidity, however, may still do nothing to stocks, as seen by their performance into the close yesterday, because balance sheet constraints prevent banks from channelling that liquidity further into the US economy where it is surely needed. From one hand, the Fed is really pushing on a string when it comes to domestic dollar liquidity, but, on the other, it is providing more than plenty abroad.
Risky assets are still a sell on any bounce, and the USD is probably a sell as well, as the Fed will be forced to keep cutting but it is now running a risk of foreign money exiting long established overweight positions in US assets.
As if rates going negative was not enough of a wake-up call that what we are dealing with is something else, something which no one alive has experienced: a build-up of private debt and inequality of extraordinary proportions which completely clogs the monetary transmission as well as the income generation mechanism. And no, classical fiscal policy is not going to be a solution either – as if years of Japan trying and failing was not obvious enough either.
But the most pathetic thing is that we are now going to fight a pandemic virus with the same tools which have so far totally failed to revive our economies. If the latter was indeed a failure, this virus episode is going to be a fiasco. If no growth could be ‘forgiven’, ‘dead bodies’ borders on criminal.
Here is why. The narrative that we are soon going to reach a peak in infections in the West following a similar pattern in China is based on the wrong interpretation of the data, and if we do not change our attitude, the virus will overwhelm us. China managed to contain the infectious spread precisely and exclusively because of the hyper-restrictive measures that were applied there. Not because of the (warm) weather, and not because of any intrinsic features of the virus itself, and not because it provided any extraordinary liquidity (it did not), and not because it cut rates (it actually did, but only by 10bps). In short, the R0 in China was dragged down by force. Only Italy in the West is actually taking such draconian measures to fight the virus.
Any comparisons to any other known viruses, present or past, is futile. We simply don’t know. What if we loosen the measures (watch out China here) and the R0 jumps back up? Until we have a vaccine or at least we get the number of infected people below some kind of threshold, anything is possible. So, don’t be fooled by the complacency of the 0.00whatever number of ‘deaths to infected’. It does not matter because the number you need to be worried about is the hospital beds per population: look at those numbers in US/UK (around 3 per 1,000 people), and compare to Japan/Korea (around 12 per 1,000 people). What happens if the infection rate speeds up and the hospitalization rate jumps up? Our health system will collapse.
UK released its Coronavirus action plan today. It’s a grim reading. Widespread transmission, which is highly likely, could take two or three months to peak. Up to one fifth of the workforce could be off work at the same time. These are not just numbers pulled out of a hat but based on actual math because scientist can monitor these things just as they can monitor the weather (and they have become quite good at the latter). And here, again, China is ahead of us because it already has at its disposal a vast reservoir of all kinds of public data, available for immediate analysis and to people in power who can make decisions and act fast, vert fast. Compare to the situation in the West where data is mostly scattered and in private companies’ hands. US seems to be the most vulnerable country in the West, not just because of its questionable leadership in general and Trump’s chaotic response to the virus so far, but also because of its public health system set-up, limiting testing and treating of patients.
Which really brings me to the issue at hand when it comes to the reaction in the markets.
The Coronavirus only reinforces what is primarily shaping to be a US equity crisis, at its worst, because of the forces (high valuation, passive, ETF, short vol., etc.) which were in place even before. This is unlikely to morph into a credit crisis because of policy support.
Therefore, if you have to place your bet on a short, it would be equities over credit. My point is not that credit will be immune but that if the crisis evolves further, it will be more like dotcom than GFC. Credit and equity crises follow each other: dotcom was preceded by S&L and followed by GFC.
And from an economics standpoint, the corona virus is, equally, only reinforcing the de-globalization trend which, one could say, started with the decision to brexit in 2016. The two decades of globalization, beginning with China’s WTO acceptance in 2001, were beneficial to the USD especially against EM, and US equities overall. Ironically, globalization has not been that kind to commodity prices partially because of the strong dollar post 2008, but also because of the strong disinflationary trend which has persisted throughout.
So, if all this is about to reverse and the Coronavirus was just the feather that finally broke globalization’s back, then it stands to reason to bet on the next cycle being the opposite of what we had so far: weaker USD, higher inflation, higher commodities, US equities underperformance.
“I am here for one reason and one reason alone. I’m here to guess what the music might do a week, a month, a year from now. That’s it. Nothing more. And standing here tonight, I’m afraid that I don’t hear a thing. Just…silence”
~Margin Call
At the moment, the popular narrative in the market is that the Fed has created the greatest liquidity boost ever. On the back of it, US stock prices, in particular, have risen in an almost vertical fashion since September 2019. The irony is that this boost of liquidity was not big enough to justify such a reaction. In fact, if we compare Fed’s recent balance sheet increase to QE 1,2,3, it becomes obvious that they have little in common, which is why central bank officials have continuously stated that this is not QE. Whether that is the case or not is not a question of trivial semantics. It actually carries important market implications: once this overestimation of Fed liquidity becomes common knowledge, the stock market would have to correct accordingly.
The large increase of autonomous factors on the liability side of the Fed’s balance sheet is at the core of this misunderstanding.
Although the Fed has indeed been doing around $100Bn worth of repo operations on a daily basis since September 2019 (less so recently), these operations are only temporary (overnight and 14-days), i.e. they cannot be taken cumulatively in ascertaining the effect on liquidity. In fact, during that period, the Fed’s balance sheet increased by only about $400bn, of which about half came from repos, the other from securities purchases, mostly T-Bills, with the increase in UST (coupons) more than offset by the decline in MBS.
Source: FRB H.4.1, BeyondOverton
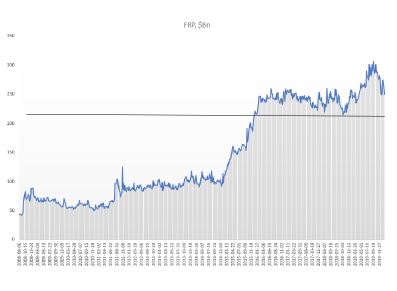
However, not all of the increase in Fed’s balance sheet went towards interbank liquidity: bank reserves rose by only about $150Bn (as of 22/01/2020), less than half of the total! Almost two-thirds went towards an increase in the Treasury General Account (TGA), which takes liquidity out. The growth of currency in circulation (which also decreases liquidity) was exactly offset by a net decline in reverse repos: a drop in the Foreign Reverse Repos (FRP), but a rise in domestic reverse repo.
Source: FRB H.4.1, BeyondOverton
Fed actually started increasing its T-Bills and coupons portfolio already in mid-August, three weeks before the repo spike. Part of that increase went towards MBS maturities. But by the end of August, Fed’s balance sheet had already started growing. By the third week of September, also the combined assets portfolio (T-Bills, coupons, MBS) bottomed out, even though MBS continued to decrease on a net basis.
Source: FRB H.4.1, BeyondOverton
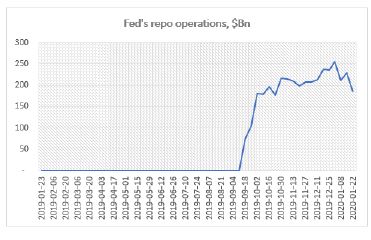
Fed’s repo operations began the second week of September. They reached a high of $256Bn during the last week of December. At $186Bn, down $70Bn from the highs, they are at the same level where they were in mid-October.
Source: FRB H.4.1, BeyondOverton
On the liability side, TGA actually bottomed out two weeks before the Fed started buying coupons and T-Bills, while the FRP topped the week the Fed started the repo operations. Could it be a coincidence? I don’t think so. My guess is that the Fed knew exactly what was going on and took precautions on time. Just as we found out that the Fed had lowered the rate paid on FRP to that of the domestic repo rate, we might also one day find out if it did indeed nudge foreigners to start moving funds away.
Source: FRB H.4.1, BeyondOverton
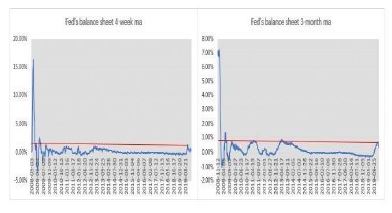
So, while the Fed’s liquidity injection since last September was substantial relative to the period when the Fed was tapering (2018) or when the balance sheet was not growing (2015-17), it is a stretch to make a claim that this is the greatest liquidity boost ever. The charts below show the 4-week and 3-month moving average percentage change in the Fed’s balance sheet. The 4-week change in September was indeed the largest boost in liquidity since the immediate aftermath of the 2008 financial crisis. The 3-month change, though, isn’t.
Source: FRB H.4.1, BeyondOverton
The Fed pumped more liquidity in the system during the European debt crisis. In the first four months of 2013, both the growth rate of the Fed’s balance sheet and the absolute increase of assets and bank reserves were higher than in the last four months of 2019. Moreover, there were no equivalent increases in either the TGA or the FRP.
Source FRB H.4.1, BeyondOverton
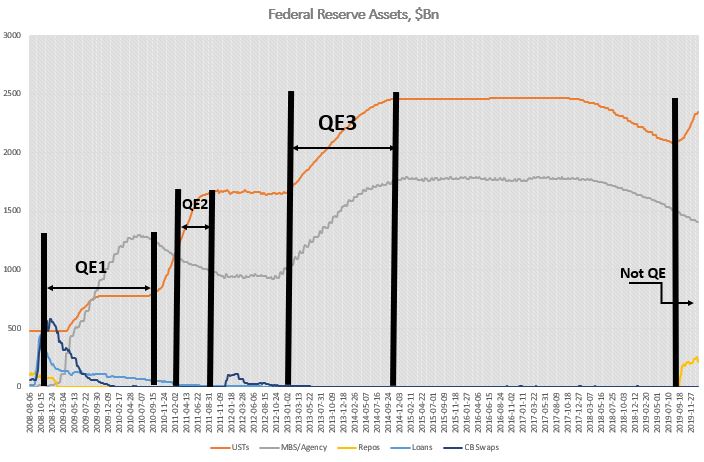
In fact, the reason Fed’s balance sheet changes this time around did not provide any substantial boost to liquidity, is precisely because they are very different from the three QE episodes immediately after the 2008 financial crisis.
For example, during QE1, the increase in securities held was more than three times the increase in Fed’s total assets. That was mostly because loans and central banks (CBs) swaps declined, to make up the difference. The Fed bought both coupons and MBS. However, 75% of the increase in assets came from a rise in MBS (from $0 to almost $1.2Tn), while T-Bills remained unchanged and agencies declined.
The Fed had begun to extend loans to primary dealers (PDs) even before September 2008, but immediately after Lehman Brothers failed, it included asset-backed/commercial paper/money market/mutual fund entities to this list of loan recipients as well. At around $400Bn, these were short-term loans, designed to pretty much make sure that no other PD or any significantly important player failed.
By the time QE1 finished most of these loans were repaid. In a similar fashion, the Fed had already put in place CBs swap lines even before September 2008, but they got really filled up, to the tune of more than $500Bn, after the Lehman Brothers event. Finally, repos actually decreased during QE1. Bottom line is, as far as Fed’s assets are concerned, September 2019 had no resemblances at all to September 2008.
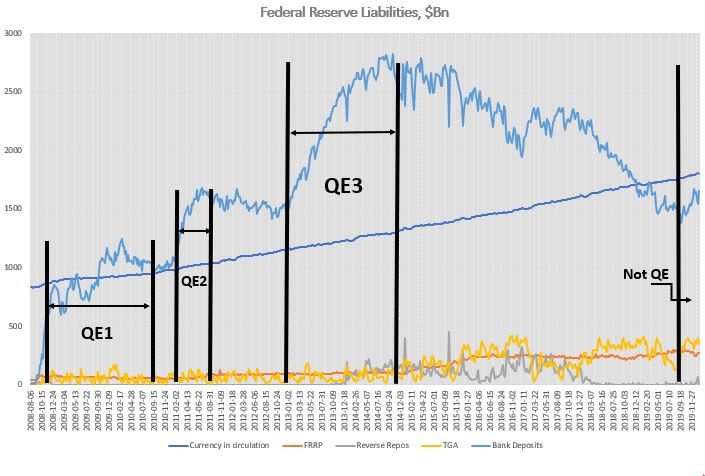
On the liability side, the differences were also stark. Unlike 2019, during QE1 bank reserves contributed to 95% of the overall increase of balance sheet. The FRP remained pretty much flat for the full duration of QE1, while the TGA was unchanged but it did exhibit the usual volatility during seasonal funding periods.
Source: FRB H.4.1, BeyondOverton
QE2 was much more straightforward than QE1. Fed’s assets increased only on the back of coupon purchases (around $600Bn), while the Fed continued to decrease its MBS and loans portfolio. On the liability side, bank reserves continued to contribute about 95% of the increase. The rest was currency in circulation. Bottom line here again is that there is really no resemblance to 2019.
QE3 was similar to QE2 in the sense that Fed’s reserves increased 100% on the back of securities purchases (around $1.6Tn), but this time split equally between coupons and MBS. On the liability side, however, at 80% of total, bank reserves contributed slightly less towards the overall increase than during QE1 or QE2. The rest was split between currency in circulation and reverse repos. So, during QE3 less of the Fed’s balance sheet increase, than during the previous QEs, contributed to liquidity overall, but still much more than in 2019.
Reverse repos were especially prominent after QE3, when the Fed stopped growing its balance sheet but before it actually started tapering it. Probably, that was the sign that the banking system was actually running enough surplus reserves that it was willing to give some of the liquidity back to the Fed.
To recap, whatever the Fed has been doing so far, starting in September 2019, has simply no comparisons with any of the previous QEs. The largest increases on the Fed’s balance sheet in 2019 were T-Bills and repos; the Fed never bought T-Bills or engaged in repos in any of the previous QEs – the asset mix was totally different. On the liability side, while in the QEs almost all of the increase went directly into bank liquidity, in 2019 less than 50% did. FRP was more or less unchanged, at around $100Bn, between the beginning of QE1 and the end of QE3, but by September 2019 it had tripled. TGA averaged around $60Bn before the end of QE3; thereafter the average increased four times!
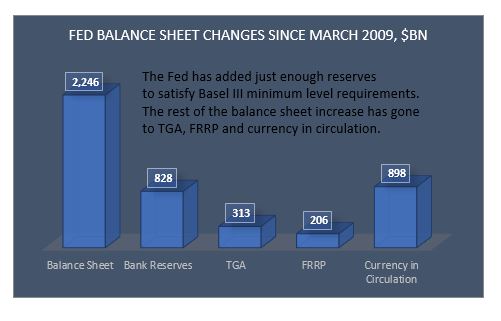
As a matter of fact, when we put the whole picture together, the case could be made that the Fed did not really create any additional liquidity at all since equities bottomed in March 2009.
Fed’s assets have increased by about $2Tn since then. But only 37% of that increase went to bank reserves. 40% went towards the natural increase of currency in circulation, 14% went to the TGA and 9% went to the FRP (last three drawing liquidity out).
Source: FRB H.4.1, BeyondOverton
Yes, bank reserves have increased by about $800Bn since then but also have bank reserves needs on the back of Basel III liquidity requirements. According to the Fed itself, the aggregate lowest comfortable level of reserve balances in the banking system ranges from $600Bn to just under $900Bn. Thus, at $1.6Tn currently, there is not much excess liquidity left in the system: on a net basis, whatever extra liquidity was created, it happened between September 2008 and March 2009.
More precisely, actually, the Fed did create surplus liquidity up to about the end of 2014. Between 2015 and the end of 2017, the liquidity in the system stayed flat. After that, the Fed started taking liquidity out, and by the middle of 2019 it left just about enough surplus liquidity (over and above the March 2009 level) to satisfy Basel III liquidity requirements.
Going forward, it is very likely that the bulk of the increase of the central bank’s balance sheet is behind us for the moment, ceteris paribus. The Fed will continue shifting from repos to T-Bills and probably coupons (especially if it hikes the IOER/repo rate, as expected). The effect on liquidity will depend on the mixture of liabilities, though. I expect the TGA to start drifting lower with seasonality as well as because it is at level associated with reversals in the past.
Source: FRB H.4.1, BeyondOverton
FRP has a bit more to go on the downside but I think it will struggle to break $200Bn, and it might settle around $215Bn. TGA and FRP declining should help liquidity even if Fed’s balance sheet does not increase. If the decline in the demand for repos is less than Fed’s securities purchases, bank reserves are likely to go up: this should help liquidity overall. Otherwise, it depends on the net effect of the change in all autonomous factors.
Source: FRB H.4.1, BeyondOverton
So, while the Fed has just about created enough liquidity to take bank reserves to the level of March 2009 (plus the reserves required to meet Basel III liquidity requirements), S&P 500 is up 10% since the Fed started this latest liquidity injections, and almost 400% since the bottom in 2009: an outstanding performance given all of the above. While the rise in the market pre 2019 can be fully attributed to massive corporate share buybacks, with active managers and real money (households, pension funds, mutual funds and insurance companies) net sellers of equities, thereafter, it is more of a mixed bag.
In 2019 retail money picked up the baton from corporates and bought the most equities since the 2008 financial crisis[1]. In addition, there has been relentless selling of volatility in the form of exotic structured retail products (mostly out of Asia[2]), betting on a continued stability and a rising trend on the back of the ongoing US corporate share buyback program, combined with the Fed’s about face on rates last year. Together with an all-time record speculative selling of VIX futures, this has left the street, generally speaking, quite long gamma, thus further helping the market’s bullish stance (to monetize their gamma exposure, dealers sell on rallies and buy on dips, thus cushioning the market on the way down, while the buying from other sources ensures the market keeps grinding higher).
Having mostly missed the extraordinary rally in US stocks during 2009-2018 (i.e. during the Fed’s previous balance sheet expansions and before the tapering), real money did not want to be left out on this one as well. However, not only the premises for this bullishness are unfounded, as discussed above, but also the internals of the previous stock market rally might be changing.
Corporate share buybacks, while still strong, are fading. This is happening for two main reasons. First, the Boeing scandal (prior to last year, Boeing was one of the largest share buyback companies in the US), I believe, is really accelerating bipartisan support to allow regulators more leeway into scrutinizing how companies choose to spend their cash. Second, with corporate earnings growth slowing down, US companies have been substantially scaling down their plans for share buybacks in 2020, anyway.
Neither the fact that the central bank liquidity is much smaller than envisioned, nor that the breadth of the rally is narrowing, seems to be on people’s radar at the moment. On the contrary, investors might be even embracing a completely new paradigm, this-time-is-different attitude, which sometimes comes at moments preceding a market correction. For example, at Davos 2020, Bob Prince, the Co-CIO of the largest hedge fund in the world, Bridgewater, said in an interview with Bloomberg TV, that he believed the boom-bust cycle was over. In fact, he went further in elaborating on this view:
“Stability could be an opportunity…You’ll hear the tremors before the earthquake. It won’t just come upon you all of a sudden. Volatility is out there, but it is not imminent.” This reminded me of the build-up to the 2008 financial crisis[3]. It’s not that people did not see the risks in subprime mortgage CDOs back then. They did, and that was why it took them some time to get in on the
[1] See Brace Your Horses, This Carriage is Broken”, BeyondOverton, January 14, 2020
[2] “How an exotic investment product sold in Korea could create havoc in the US options market”, Bloomberg, January 20, 2020
[3] “When the music stops, in terms of liquidity, things will be complicated. But as long as the music is playing, you’ve got to get up and dance.”, Chuck Prince, CEO of Citibank, the largest US bank in 2007.
Following up on the ‘easy’ question of what to expect the effect of the Corona Virus will be in the long term, here is trying to answer the more difficult question what will happen to the markets in the short-to-medium term.
Coming up from the fact that this was the steepest 6-day stock market decline of this magnitude ever (and notwithstanding that this was preceded by a quite unprecedented market rise), there are two options for what is likely to happen next week:
During the weekend, the number of Corona Virus (CV) cases in the West shoots up (situation starts to deteriorate rapidly) which causes central banks (CB) to react (as per ECB, Fed comments on Friday) -> markets bounce.
CV news over the weekend is calm, which further reinforces the narrative of ‘this too shall pass’: It took China a month or so, but now it is recovering -> markets rally.
While it is probably obvious that one should sell into the bounce under Option 1, I would argue that one should sell also under Option 2 because the policy response, we have seen so far from authorities in the West, and especially in the US, is largely inferior to that in China in terms of testing, quarantining and treating CV patients. So, either the situation in the US will take much longer than China to improve with obviously bigger economic and, probably more importantly, political consequences, or to get out of hand with devastating consequences.
It will take longer for investors to see how hollow the narrative under Option 2 is than how desperately inadequate the CB action under Option 1 is. Therefore, markets will stay bid for longer under Option 2.
The first caveat is that if under Option 1 CBs do nothing, markets may continue to sell off next week but I don’t think the price action will be anything that bad as this week as the narrative under Option 2 is developing independently.
The second caveat is that I will start to believe the Option 2 narrative as well but only if the US starts testing, quarantining, treating people in earnest. However, the window of opportunity for that is narrowing rapidly.
What’s the medium-term game plan?
I am coming from the point of view that economically we are about to experience primarily a ‘permanent-ish’ supply shock, and, only secondary, a temporary demand shock. From a market point of view, I believe this is largely an equity worry first, and, perhaps, a credit worry second.
Even if we Option 2 above plays out and the whole world recovers from CV within the next month, this virus scare would only reinforce the ongoing trend of deglobalization which started probably with Brexit and then Trump. The US-China trade war already got the ball rolling on companies starting to rethink their China operations. The shifting of global supply chains now will accelerate. But that takes time, there isn’t simply an ON/OFF switch which can be simply flicked. What this means is that global supply chains will stay clogged for a lot longer while that shift is being executed.
It’s been quite some since the global economy experienced a supply shock of such magnitude. Perhaps the 1970s oil crises, but they were temporary: the 1973 oil embargo also lasted about 6 months but the world was much less global back then. If it wasn’t for the reckless Fed response to the second oil crisis in 1979 on the back of the Iranian revolution (Volcker’s disastrous monetary experiment), there would have been perhaps less damage to economic growth. Indeed, while CBs can claim to know how to unclog monetary transmission lines, they do not have the tools to deal with supply shocks: all the Fed did in the early 1980s, when it allowed rates to rise to almost 20%, was kill demand.
CBs have learnt those lessons and are unlikely to repeat them. In fact, as discussed above, their reaction function is now the polar opposite. This is good news as it assures that demand does not crater, however, it sadly does not mean that it allows it to grow. That is why I think we could get the temporary demand pullback. But that holds mostly for the US, and perhaps UK, where more orthodox economic thinking and rigid political structures still prevail.
In Asia, and to a certain extent in Europe, I suspect the CV crisis to finally usher in some unorthodox fiscal policy in supporting directly households’ purchasing power in the form of government monetary handouts. We have already seen that in Hong Kong and Singapore. Though temporary at the moment, not really qualifying as helicopter money, I would not be surprised if they become more permanent if the situation requires (and to eventually morph into UBI). I fully expect China to follow that same path.
In Europe, such direct fiscal policy action is less likely but I would not be surprised if the ECB comes up with an equivalent plan under its own monetary policy rules using tiered negative rates and the banking system as the transmission mechanism – a kind of stealth fiscal transfer to EU households similar in spirit to Target2 which is the equivalent for EU governments (Eric Lonergan has done some excellent work on this idea).
That is where my belief that, at worst, we experience only a temporary demand drop globally, comes from, although a much more ‘permanent’ in US than anywhere else. If that indeed plays out like that, one is supposed to stay underweight US equities against RoW equities – but especially against China – basically a reversal of the decades long trend we have had until now. Also, a general equity underweight vs commodities. Within the commodities sector, I would focus on longs in WTI (shale and Middle East disruptions) and softs (food essentials, looming crop failures across Central Asia, Middle East and Africa on the back of the looming locust invasion).
Finally, on the FX side, stay underweight the USD against the EUR on narrowing rate differentials and against commodity currencies as per above.
The more medium outlook really has to do with whether the specialness of US equities will persist and whether the passive investing trend will continue. Despite, in fact, perhaps because of the selloff last week, market commentators have continued to reinforce the idea of the futility of trying to time market gyrations and the superiority of staying always invested (there are too many examples, but see here, here, and here). This all makes sense and we have the data historically, on a long enough time frame, to prove it. However, this holds mostly for US stocks which have outperformed all other major stocks markets around the world. And that is despite lower (and negative) rates in Europe and Japan where, in addition, CBs have also been buying corporate assets direct (bonds by ECB, bonds and equities by BOJ).
Which begs the question what makes US stocks so special? Is it the preeminent position the US holds in the world as a whole? The largest economy in the world? The most innovative companies? The shareholders’ primacy doctrine and the share buybacks which it enshrines? One of the lowest corporate tax rates for the largest market cap companies, net of tax havens?…
I don’t know what is the exact reason for this occurrence but in the spirit of ‘past performance is not guarantee for future success’s it is prudent when we invest to keep in mind that there are a lot of shifting sands at the moment which may invalidate any of the reasons cited above: from China’s advance in both economic size, geopolitical (and military) importance, and technological prowess (5G, digitalization) to potential regulatory changes (started with banking – Basel, possibly moving to technology – monopoly, data ownership, privacy, market access – share buybacks, and taxation – larger US government budgets bring corporate tax havens into the focus).
The same holds true for the passive investing trend. History (again, in the US mostly) is on its side in terms of superiority of returns. Low volatility and low rates, have been an essential part of reinforcing this trend. Will the CV and US probably inadequate response to it change that? For the moment, the market still believes in V-shaped recoveries because even the dotcom bust and the 2008 financial crisis, to a certain extent, have been such. But markets don’t always go up. In the past it had taken decades for even the US stock market to better its previous peaks. In other countries, like Japan, for example, the stock market is still below its previous set in 1990.
While the Fed has indeed said it stands ready to lower rates if the situation with the CV deteriorates, it is not certain how central bankers will respond if an unexpected burst of inflation comes about on the back of the supply shock (and if the 1980s is any sign, not too well indeed). Even without a spike in US interest rates, a 20-30 VIX investing environment, instead of the prevailing 10-20 for most of the post 2009 period, brought about by pulling some of the foundational reasons for the specialness of US equities out, may cause a rethink of the passive trend.
Initially published on MacroHive on February 6, 2020
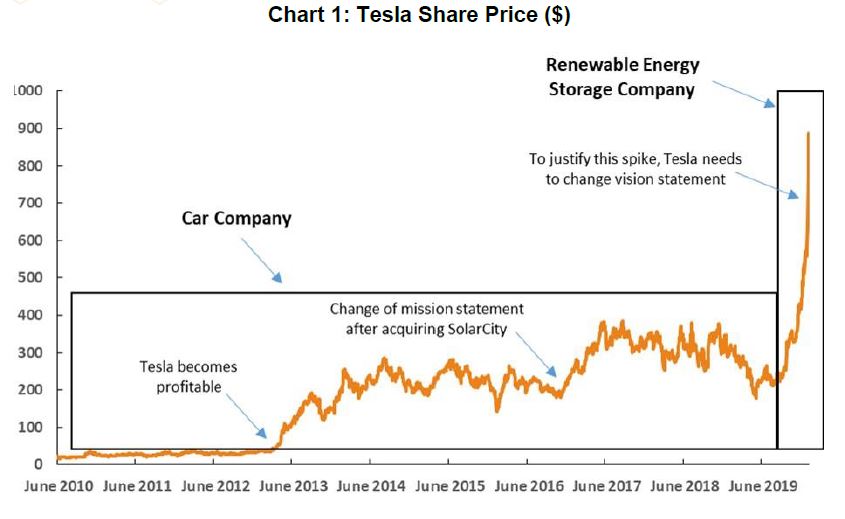
In light of the vertical rise in Tesla’s share price in the last few months, I thought it worthwhile to revisit an old narrative comparing the Apple’s iPhone moment with Tesla now. My verdict: I wouldn’t get sucked in by any ‘paradigm shift’ just yet. Though there are plenty of possible reasons and even more conspiracy theories, this share price spike is likely nothing other than mad short covering.
Having said that, Tesla might be worth this much – indeed maybe even more. But the story has to change: Tesla is not a car company, and it is not in the mobility business; instead, it is an energy storage company, and it is in the renewable energy business.
The iPhone shifted the paradigm because it distinguished itself as a mobile device, not a mobile phone. Moreover, the iPhone arrived at the very beginning of the internet/social media/digital cycle. Tesla is still a car (you need to drive it!), albeit without an internal combustion engine, and it comes at the end of the mobility cycle. After all, cars have been around in roughly the same form for at least 100 years. Air travel was a much bigger disruptor. If you want an iPhone analogy in the mobility cycle, it’s that, not Tesla. The fact that air travel is a money loser now also supports the idea that we are at the end of the traditional mobility cycle.
The Autonomous Vehicle (AV) could be the next big disruptor in the mobility sector, not the Electric Vehicle (EV) – which is what Tesla currently is. People are much more likely to use an AV than an EV because in an AV they are free to do whatever they want while it transports them. It also has the potential to be cheaper and more comfortable than a driver-operated EV taxi.
The problem with AV, still, is that it is a long way off. Elon Musk had initially set a deadline of fully autonomous driving by the end of 2019. That obviously did not happen. During the company’s Q4’2019 earnings call, Musk said that it might happen in a few months. But he downplayed how well the system would work, clarifying, “That doesn’t mean the features are working well”. This is not just a question of technology (for example, given the complexity of the urban landscape, city driving requires fully Level 5 automation), but it is also a question of regulations and costs. By the time the fully AV is available, probably not before the 2030s, especially in urban settings, the demand for it, will likely be lower simply because the digital medium would have evolved much more, surpassing the physical medium in terms of popularity.
So, if Tesla is not at its ‘iPhone’ moment, what could justify such a high share price?
Source: Nasdaq
As a car company, the $150bn market capitalisation makes little sense given comps in the industry. Though the last three quarters have finally been cash-flow positive, if the latest number of $976mm is properly discounted by the stock-based compensation of $898mm (accounted as a non-cash cost), the free cash flow (FCF) is not that big. And bear in mind that to get to it, Tesla had to halve its initial 2019 CAPEX from $2.5Bn, projected in Q1’2019, to what came to be the real 2019 number of $1.3bn. With one of the lowest CAPEX as a percentage of revenues in the business, it is difficult to imagine how Tesla will compete with the other car producers.
Tesla as a software company (similar to Uber and Lyft, i.e. turning into a utility as a platform) could possibly push the valuation up a bit, but hardly to where we are now given that Uber’s market cap is less than half of Tesla’s. The only way to get to the escape velocity we have been experiencing in the share price now is to completely exit the mobility sector and to focus on energy storage as the missing link in our society’s transition to a renewable energy future.
There is an argument to be made that this could have been Elon Musk’s initial idea. In 2004, less than a year after founding Tesla, Musk and his cousin thought of starting SolarCity during a trip to Burning Man, realising solar power’s potential in countering climate change. Tesla acquired SolarCity in 2016 and, in that same year, the company’s mission statement changed from ‘transitioning the world to sustainable transport’ to ‘accelerate the world’s transition to sustainable energy’.
But still, to get to today’s valuation, Tesla would have to put on a smart PR exercise talking about this mission statement shift in detail. To go higher from here, Tesla would need to align its vision statement, ‘to create the most compelling car company of the 21st century by driving the world’s transition to electric vehicles’ to its mission statement above. i.e.Tesla needs to completely drop the transportation angle (where margins are only going lower) and invest a lot more in CAPEX and R&D with a focus on developing the best renewable storage options.
If then the market understands where Tesla is committed to going and believes in its technological abilities, it will drop all its requirements for near-term profitability and start pricing the stock with a much higher multiple – one more in line with other near-monopoly companies with a first-mover advantage. Barring any such efforts, Tesla’s stock is probably heading down as soon as the short covering is finished. At the end of the day, valuations are a matter of perceptions and assumptions first, and only then a question of whether the numbers fit. Wednesday [February 4] saw the start of this correction with a 17% drop. The only question now is whether the selloff will be as fast as on the way up.
I am late in this debate, at least in writing, because at first, I thought it did not matter; it is all semantics. Last week I read John Authers’ article in Bloomberg in which he referenced a chart from CrossBorder Capital that showed that the Fed had recently injected the greatest liquidity boost ever. That got me really curious, so I did some digging in the Fed’s balance sheet and I concluded, notwithstanding that I am not privy of how CrossBorder Capital defines and measures liquidity, it is unlikely that the Fed’s actions led to the ‘greatest liquidity boost ever’. And then yesterday Dallas Fed President Kaplan said he was worried about the Fed creating asset bubbles. This pushed the ‘old’ narrative that CBs’ liquidity/NIRP/ZIRP is creating a mad search for yield and a rush in risky assets out of the woodwork again on social media. So, that got me thinking that whatever the Fed did since last September, whether it is QE or not, actually matters.
So, just to refresh, since September 2019, the Fed’s balance sheet increased by about $400bn, of which more than half came from repos, the other from mostly T-Bills, with the increase in coupons more than offset by the decline in MBS. On the liability side, there was a similar breakdown: about 50% came from an increase in bank deposits, the other 50% came from an increase in currency in circulation and the TGA account. This 50/50 in both assets and liabilities is important to keep in mind.
Source FRB H.4.1, BeyondOverton
During QE1, the increase in securities held was more than 3x the increase in Fed’s total assets. That was mostly because loans and CBs swaps declined to make up the difference. On the securities side, the Fed bought both coupons and MBS. T-Bills remained the same, while agencies declined. However, 75% of the increase in assets came from a rise in MBS (from $0 to almost $1.2Bn). The Fed had begun to extend loans to some market players even before September 2008, but immediately after Lehman Brothers failed, the Fed extended loans to primary dealers (PD) as well as asset-backed/commercial paper/money market/mutual fund entities to the tune of about $400Bn. These were very temporary loans, pretty much making sure that no other PD or any other significantly important player failed. By the time QE1 finished the loans had gone back to almost pre-Lehman-time sizes. In a similar fashion, the Fed had already put in place CBs swaps even before September 2008, but immediately thereafter, the CB swap line jumped to more than $500Bn, and by the time QE1 finished it had gone to $0. Finally, repos actually decreased during QE1. Bottom line is, as far as Fed’s assets are concerned, September 2019 had absolutely no resemblances at all to September 2008.
Source: FRB H.4.1, BeyondOverton
On the liability side, the differences were also stark. Unlike 2019, during QE1 bank reserves contributed to 95% of the increase. The FRRP account remained pretty much flat for the full duration of QE1, while the TGA account was unchanged but it did exhibit the usual volatility during seasonal funding periods.
QE2 was much more straightforward than QE1. The Fed’s assets increased only on the back of coupon purchases (around $600Bn), while the Fed continued to decrease its MBS and loans portfolio. On the liability side, bank reserves continued to contribute about 95% of the increase. The rest was currency in circulation. Bottom line here again, really no resemblance to 2019.
QE3 was similar in the sense that Fed’s reserves increased 100% on the back of securities purchases (around $1.6Tn), but this time split equally between coupons and MBS. On the liability side, at 80% of total, bank reserves contributed slightly less towards the overall increase. The rest was split between currency in circulation and reverse repos. During QE3, unlike QE1 and QE2, less of the Fed’s balance sheet increase went towards higher liquidity (bank reserves), but still nothing like in 2019. For one reason or another, the market was willing to give some of the liquidity back to the Fed in the form of reverse repos even before the Fed started tapering (reverse repos were prominent after QE3 when the Fed stopped growing its balance sheet but before it actually started tapering it).
No, you can’t call whatever the Fed has been doing so far, starting in September 2019, QE. There are simply no comparisons with any of the previous QEs: The largest increases on the Fed’s balance sheet in 2019 was T-Bills and repos; the Fed never bought T-Bills or engaged in repos in any of the previous QEs – the asset mix was totally different. On the liability side, while in the QEs almost all of the increase went directly into bank liquidity, in 2019 only 50% did. FRRP was more or less unchanged, at around $100Bn between QE1 start and the end of QE3 – by September 2019 it had tripled! TGA averaged around $60Bn before the end of QE3; thereafter the average increased 4x!
As to the second issue of how much of the Fed’s liquidity injection since the crisis has boost asset prices? Not much.
According to the Fed’s own flow of funds data, real money has been a net seller of equities and buyer of risk-free assets since the 2008 financial crisis. If there is a rush into risky assets, it is not obvious from the data. There is also this argument that the Fed’s consistent boost of liquidity, combined with low interest rates, provides the proverbial put for prices and, therefore, the search for yield can be implemented by selling vol/gamma. This could indeed be the case. The problem is that I have not seen any data which shows exactly what the $ notional (in cash equities) equivalent of that vol selling flow is.
Moreover, given that both ECB and BOJ have engaged in even bigger balance sheet expansions, plus their interest rates are negative, the case could be made for a similar exercise in Europe and Japan. However, both European and Japanese equity markets have been languishing for years, underperforming US equity markets. Finally, even if this indeed were the case, the more likely explanation for the reasons people would be selling vol is the relentless bid from corporates engaging in share buybacks. This would also explain the underperformance of equity markets abroad relative to US ones despite higher CBs’ liquidity boosts there.
But how much liquidity did the Fed provide since the 2008 financial crisis?
Source: FRB H.4.1, BeyondOverton
Equities bottomed in March 2009. Fed’s assets increased by about $2Tn thereafter. But only 37% of that increase went to bank reserves. 40% went towards the natural increase of currency in circulation, 14% went to TGA and 9% went to the FRRP (drawing liquidity out). It is slightly better if one does the comparison since QE1, but even there, at most, 50% went directly to bank reserves.
Finally, one has to take into account that banks’ reserves needs have also substantially increased since the 2008 financial crisis on the back of Basel III requirements. According to the Fed itself, the aggregate lowest comfortable level of reserve balances in the banking system ranges from $600Bn to just under $900Bn. At $1.6Tn currently, there is not much excess liquidity left in the system. In fact, banks Fed deposits were already at around $800bn in March 2009. Given that most of the regulations were implemented thereafter, one could claim that no additional liquidity was really added to the banking system since.
ETFs are not like subprime CDOs but they come close. Direct access to the Fed’s balance sheet will become essential for fund managers’ survival during the next financial crisis.
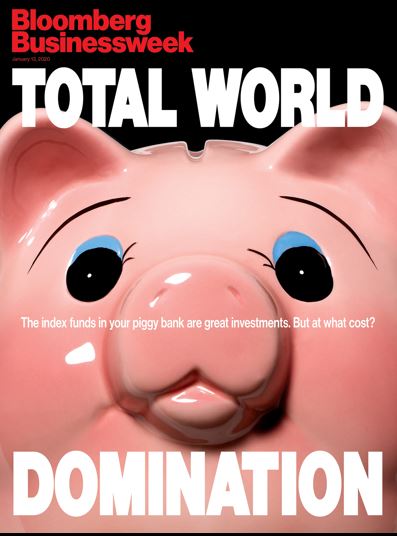
According to Bloomberg Magazine, the largest asset managers in the world, BlackRock, Vanguard and State Street, hold about 80% of all indexed money.
“Some 22% of the shares of the typical S&P 500 company sits in their portfolios, up from 13.5% in 2008…BlackRock, Vanguard, and State Street combined own 18% of Apple Inc.’s shares, up from 7% at the end of 2009… The phenomenon can be even more pronounced for smaller companies.”
This high concentration is the most serious danger to stock market bulls. Though, it is not obvious what the trigger for a market decline could be, when it happens, the present market structure could make it a much worse experience than the 2008 stock market decline.
Unlike 2008, however, the risks are on the buyside and the market doesn’t seem leveraged. But like 2008, the Fed is probably in the dark to the actual risks in the system, because the buyside is like shadow banking: no one knows what is going on/off fund managers’ balance sheets. Like the broker-dealers of pre-2008, the buyside today does not have access to the Fed’s balance sheet. The Prime Dealers Credit Facility (PDCF), which allowed access to borrowing from the Fed, was only created after Bear Stearns ‘failed’. Still, PDCF did not help Lehman Brothers, even though the latter did have good collateral at hand.
The buyside now may not be leveraged that much indeed but the extreme concentration of positions leads to the same effect on liquidity under stress as in 2008. This concentration is worsened by the fact that ETF sizes are many times larger than the underlying assets/markets in many cases. And though in 2008 broker-dealers ‘could’ possibly get some liquidity if they had good collateral, now the interbank market is much trickier as banks are in a regulatory straitjacket and it is not obvious (barring de-regulation) how they can provide much more liquidity even under normal conditions.
Does this make ETFs as dangerous as subprime CDOs of the 2000s indeed? I don’t know, but it makes them not that different at the same time. For example, we know that at least 40% of S&P 500 companies are money losing and we know that there is very high concentration of risk in them as per the Bloomberg Magazine article above (for comparisons, the percentage of subprime mortgages in 2000s CDOs varied between 50% in 2003 to 75% in 2007).
There are also similarities in the way the two markets emerged. In the late 1990s the Clinton administration decided not only to close the budget deficit but to also run a surplus. Bad things happen in financial markets when the US runs a budget surplus and reduces the flow of safe assets (thankfully, it does not happen often). The market responded by creating fake safe assets, like (subprime) CDOs.
In a similar fashion to the US Treasury actions of the late 1990s, US corporates have been buying back their shares, significantly reducing US public share count in the process. As the financial sector kept growing, it was starved of options where to put its money. How did the market respond? Fund managers (mostly, but also some banks) started creating ETFs. Just like CDOs, with the ETFs you buy the pure-bred stallions and the broken carriage as a package – you don’t have a choice. And as the passive/indexing trend spread, concentration soared further.
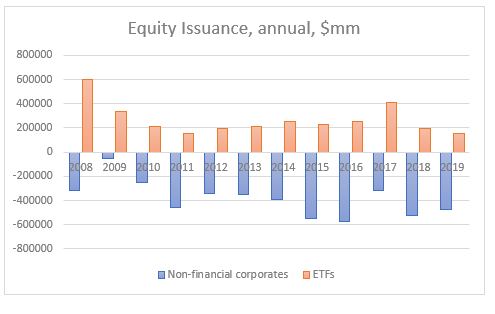
Non-financial corporate issuance has indeed been negative (corporates bought back shares) since 2008 at $4.6Tn, cumulative, but ETFs issuance is a positive $3.2tn. So, net there is still a reduction in public equity flow but nothing as dramatic as some sell side analysts claim (excluding US equity issuance abroad – see below).
Source: Federal Reserve Z1 Flow of Funds, beyondoverton
And the flip side of that is retail, which has indeed been selling equities direct but also buying indirect through ETFs – so, similarly, households have sold equity risk down but not as much as claimed – in a sense, retail buying is ‘masked’ in the flows (it is simply an incomplete ‘wash’ from owning equities direct in an active form to owning equities indirect in passive ETFs).
Actually, in 2019 households bought the most equities direct since the crisis. Foreigners and mutual funds, on the other hand, sold the most equities since the crisis. And equity issuance was the most negative (in the chart below, it is shown as a positive number to signify equity share buybacks).
Source: Federal Reserve Z1 Flow of Funds, beyondoverton
Equity issuance above is comprised of non-financial corporate, ETF and new issues abroad. When most sell side analysts report share buybacks, they only take into consideration net domestic non-financial corporate issuance. But ETFs and new issues abroad also matter from a flow perspective. The big change in 2019 was, in fact, the new issuance abroad which was negative – the last time it was negative was in 2008 (the data for 2019 is as of Q3, but it is annualized for comparison purposes).
Unlike 2008, however, it is not obvious to me where the trigger for the unwind of the ETF flow would come from. With the CDOs it was ‘easy’ – all it took was for rates to rise to ‘cripple’ both the mortgage payer and the leveraged CDOs owner. The debt overhang today is actually even bigger than in 2007, but the Fed’s failed experiment between 2016-2018 pretty much assures rates will stay low for the foreseeable future. Still, even though there is not much leverage in the system now, the high concentration of risk could produce the same effect on liquidity as if there were. But you still need a ‘seller’ to start the carriage rolling down the hill, don’t you?
This seller could be retail as an unwind of the 2019 inflow. Or the ‘selling’ could come from US corporates themselves (in the form of less buying back of their own shares – or no buying at all as a response to a regulatory change – but the latter is a 2021 event, post US presidential election, most likely). Or it could be a natural decline in share buybacks as a response to a drop in corporate Free Cash Flows (FCF) on the back of top-line revenues having peaked already (for the 17 out of 20 largest share buyback companies that is indeed the case).
The need for liquidity from fund managers is unlikely to be provided by the banking system, which is even now, without any stress, constrained by Basel III regulations to expand sufficiently its balance sheet. The Fed could be either forced to start buying equities to stem the slide and allow fund managers to meet redemptions, or it could extend a direct line of liquidity to them in a similar fashion to the creation of PDCF in 2008 for the primary dealers. My bet is on the latter as a politically more acceptable solution.
No financial crises are alike but a precondition for all of them is an extreme build-up of either economic or structural market imbalance. The next crisis is more likely to be a function of the latter one, namely high concentration of risk in institutions without direct access to liquidity from the Fed.
As for the trigger for the crisis, we can only speculate. Anyway, there isn’t usually one trigger per se but rather a combination. And we are only meant to figure that out in retrospect. But it is important to do away with two wrong narratives. First, that retail accounts have been large sellers of equities, and second, that the supply of equities has been hugely negative.
This note showed that neither of them holds water. ETF flow is at the core of the matter here. On one hand, it has facilitated the issuance of plenty equity-like instruments to make up for some of the lack of direct equity issuance, and, on the other, it has allowed retail to partially switch from active and direct equity management to passive and indirect one. In doing so, it has created the said market imbalance.