• About
  • BeyondOverton Travel
    • Silk Road (1): If Turkey is in crisis, it’s not obvious visiting it
    • Silk Road (2): Could beautiful nature and ancient history create a false sense of entitlement?
    • Silk Road (3): Fast Car
    • Silk Road (4):We took a bus ride to Iran
    • Silk Road (5): Border bothers
    • Silk Road (6): Chevrolet Land
    • Silk Road (7): Free-roaming camels and wild horses
    • Silk Road (8): China West to East
    • Silk Road (9): I have not told half of what I saw
  • BLOG
  • g88kboy Travel
    • On the Silk Road
    • Bulgaria : The Chicken crossed the Road
    • Turkey : The Country, not the Bird
    • Georgia on my Mind
    • Armenian Ayran
    • Iran – The Curious Land
    • An American in Azerbaijan
    • Uzbekistan: Golden Teeth and Neon Signs
    • Kazakhstan: Thirty Sweating Seniors
    • China Part One – Pandas Are Extinct
    • China Part Two: My TED Talk (Deep Analysis)
    • Phillipines – They Relax, I (pretend to😉) Study
    • Singapore: flashing trees and a torrent of tears
    • Malaysia: That ain’t no croc, it’s a log
    • Brunei: The Instinctive Fight for Superior Domination
    • Phillipines: Hello Friend Again
  • Outside the window
    • Bulgaria
    • Turkey
    • Georgia
    • Armenia
    • Iran
    • Azerbaijan
    • Uzbekistan
    • Kazakhstan

BeyondOverton

~ let's move this window

BeyondOverton

Monthly Archives: July 2020

Record liquidity leads to record net issuance of financial assets

06 Monday Jul 2020

Posted by beyondoverton in Asset Allocation, Debt, Equity, Monetary Policy

≈ Leave a comment

Tags

corporate bonds, Rates, share buybacks

At $3.2Tn, US Treasury (UST) net issuance YTD (end of June) is running at more than 3x the whole of 2019 and is more than 2x the largest annual UST issuance ever (2010). At $1.4Tn, US corporate bond issuance YTD is double the equivalent last year, and at this pace would easily surpass the largest annual issuance in 2017. According to Renaissance Capital, US IPO proceeds YTD are running at about 25% below last year’s equivalent. But taking into consideration share buybacks, which despite a decent Q1, are expected to fall by 90% going forward, according to Bank of America, net IPOs are still going to be negative this year but much less than in previous years.

Net issuance of financial assets this year is thus likely to reach record levels but so is net liquidity creation by the Fed. The two go together, hand by hand, it is almost as if, one is not possible without the other. In addition, the above trend of positive Fixed Income (FI) issuance (both rates and credit) and negative equity issuance has been a feature since the early 1980s.

For example, cumulative US equity issuance since 1946 is a ($0.5)Tn. Compare this to total liquidity added as well as issuance in USTs and corporate bonds.*

The equity issuance above includes also financial and foreign ADRs. If you strip these two out, the cumulative non-financial US equity issuance is a staggering ($7.4)Tn!

And all of this happened after 1982. Can you guess why? SEC Rule 10b-18 providing ‘safe harbor’ for share buybacks. No net buybacks before that rule, lots of buybacks after-> share count massively down. Cumulative non-financial US equity issuance peaked in 1983 and collapsed after. Here is chart for 1946-1983.

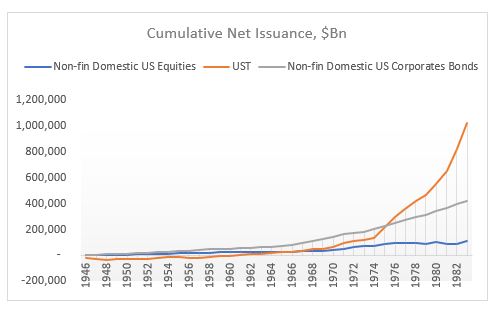
Equity issuance still lower than debt issuance but nothing like what happened after SEC Rule10B-18, 1984-2019.

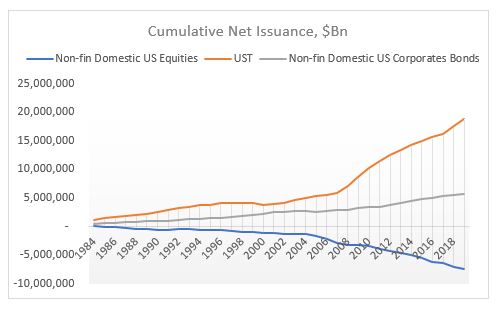
Buybacks have had an enormous effect on US equity prices on an index basis. It’s not as if all other factors (fundamentals et all) don’t matter, but when the supply of a financial asset massively decreases while the demand (overall liquidity – first chart) massively increases, the price of an asset will go up regardless of what anyone thinks ‘fundamentals’ might be. People will create a narrative to justify that price increase ex post. The only objective data is demand/supply balance.

*Liquidity is measured as Shadow Banking + Traditional Banking Deposits. Issuance does not include other debt instruments (loans, mortgages) + miscellaneous financial assets. Source: Z1 Flow of Funds

Subscribe

  • Entries (RSS)
  • Comments (RSS)

Archives

  • January 2023
  • December 2022
  • November 2022
  • August 2022
  • February 2022
  • April 2021
  • November 2020
  • October 2020
  • September 2020
  • August 2020
  • July 2020
  • June 2020
  • May 2020
  • April 2020
  • March 2020
  • February 2020
  • January 2020
  • December 2019
  • November 2019
  • October 2019
  • May 2019
  • March 2019
  • February 2019
  • January 2019
  • December 2018
  • November 2018
  • October 2018
  • September 2018
  • August 2018
  • June 2018
  • May 2018
  • March 2018
  • February 2018
  • January 2018
  • November 2017
  • October 2017
  • September 2017
  • August 2017
  • July 2017
  • June 2017

Categories

  • AI
  • Asset Allocation
  • blockchain
  • China
  • De-urbanization
  • Debt
  • Decentralization
  • EM
  • Energy
  • Equity
  • FX
  • g88kboy
  • Monetary Policy
  • Politics
  • Questions
  • Quotes
  • The last man standing will laugh
  • Travel
  • UBI
  • Uncategorized
  • VR

Meta

  • Register
  • Log in

Blog at WordPress.com.

  • Follow Following
    • BeyondOverton
    • Join 73 other followers
    • Already have a WordPress.com account? Log in now.
    • BeyondOverton
    • Customize
    • Follow Following
    • Sign up
    • Log in
    • Report this content
    • View site in Reader
    • Manage subscriptions
    • Collapse this bar
 

Loading Comments...