
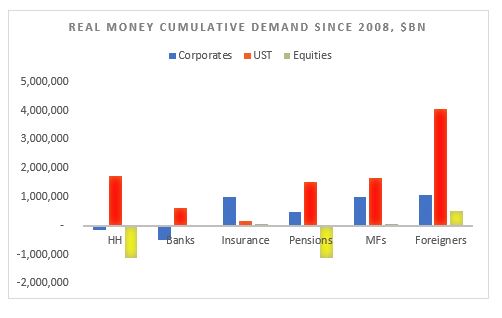
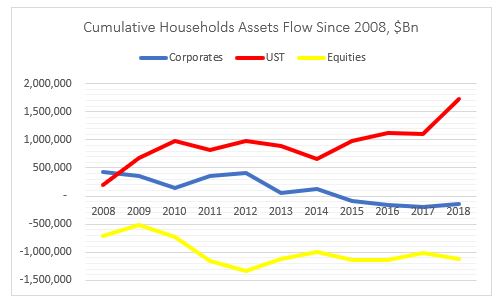
Households have massively deleveraged: sold about $1Tn of US equities and bought about $2Tn of USTs. The have also marginally divested from corporate bonds.
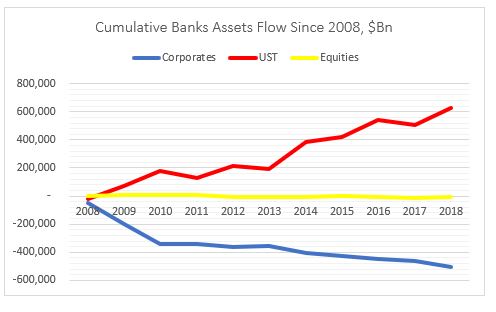
Banks have deleveraged as well: bought about $0.5Tn of UST while selling about the same amount of equities. The have also marginally divested from corporate bonds.
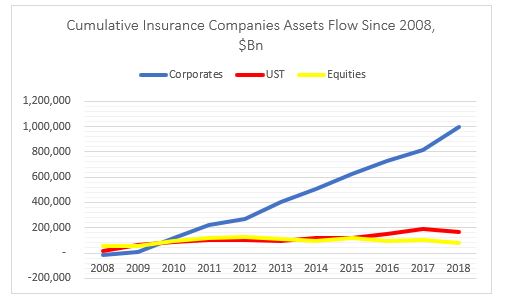
Insurance companies have put on risk: bought about $1Tn of corporate bonds and small amounts of both equities and USTs.
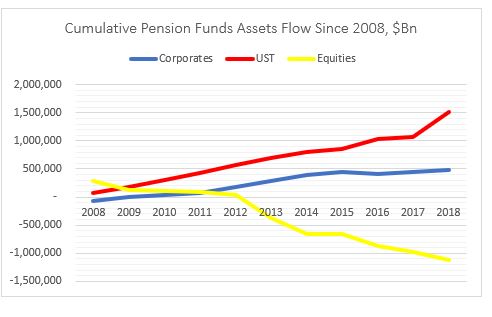
Mix bag for pension funds with a slight deleveraging: bought $0.5Tn of corporate bonds but sold about $1Tn of equities. But also bought $1.5Tn of USTs.
Mutual funds have put on risk: bought about $1Tn of corporate bonds and small amount of equities. Also bought more than $1.5Tn USTs.

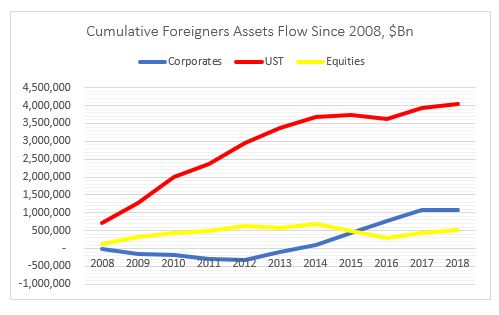
Finally, foreigners have also put on risk: bought $1Tn of corporate bonds, $0.5Tn of equities and $4Tn of USTs.
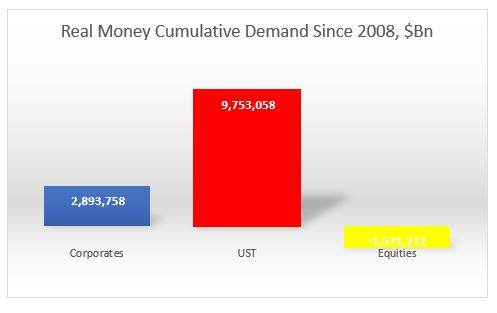
Overall, the most (disproportionate) flows went into USTs, followed by US corporates. Demand for equities was actually negative from real money.
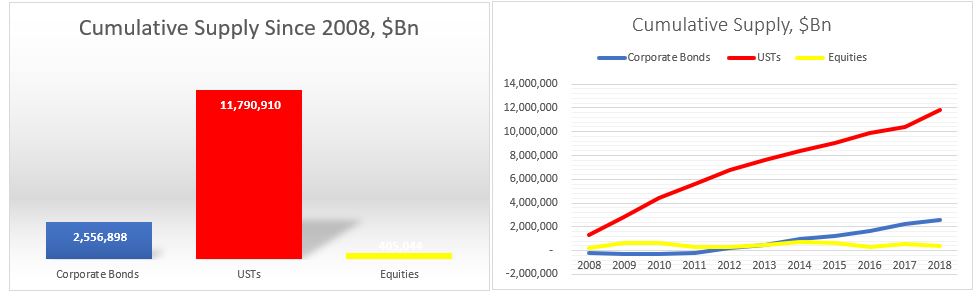
What about supply?
Issuance of USTs was naturally the dominant flow followed by US corporates and US equities.
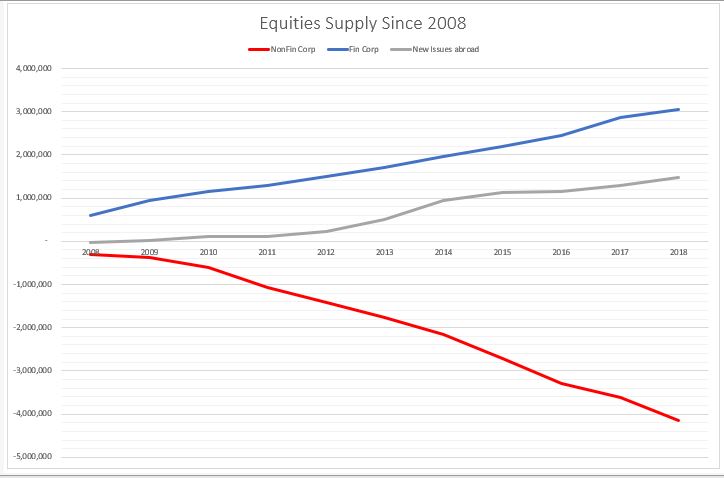
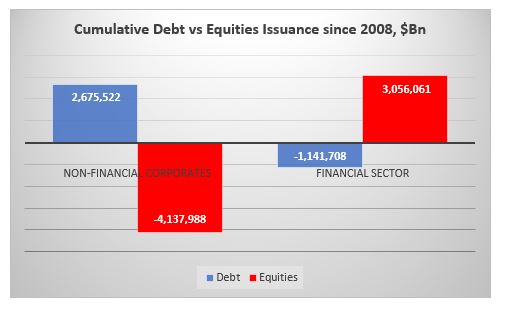
On the US equities side, however, there is a very clear distinction between US non-financial corporate issuance, which is net negative (i.e. corporates bought back shares) and US financial and US corporate issuance abroad, which is net positive. In other words, the non-corporate buybacks (more than $4Tn) were offset by the financial sector (ETF) and ‘ADRs’ issuance.
The opposite is happening on the corporate supply side. Non-financial corporates have done the majority of the issuance while the financial sector has deleveraged (reduced debt liabilities).
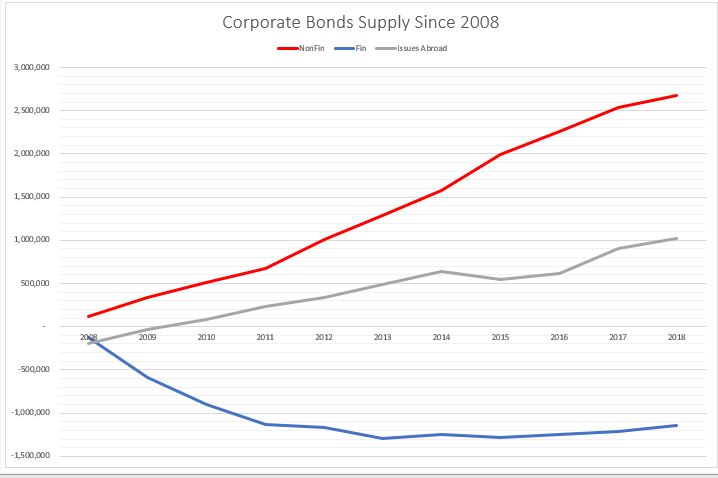
In other words, non-financial corporates have bought back their shares at the expense of issuing debt, while the financial sector (ETFs) has issued equities and reduced their overall indebtedness.
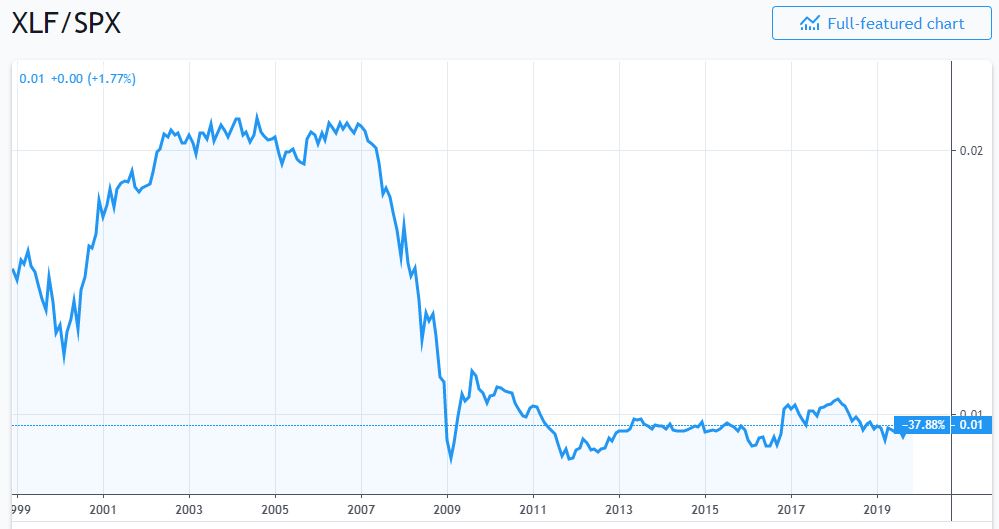
No wonder, then that financial sector shares have underperformed the overall market since 2009.
Putting the demand and supply side together this is how the charts look.
On the equities side, the buying comes mostly from ETFs (in ‘Others’ – that is basically a ‘wash’ from the issuance) and foreigners. The biggest sellers of equities are households and pension funds. The rest of the players, more or less cancel each other out.

So, households and pension funds, ‘sold’ to ETFs and foreigners.

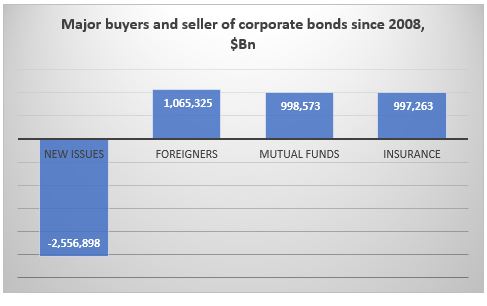
On the corporate bonds side, the main buyers were foreigners, mutual funds and insurance companies. Pension funds also bought. The main seller were the banks. ‘Others’ (close end funds etc.) and households also sold a small amount.
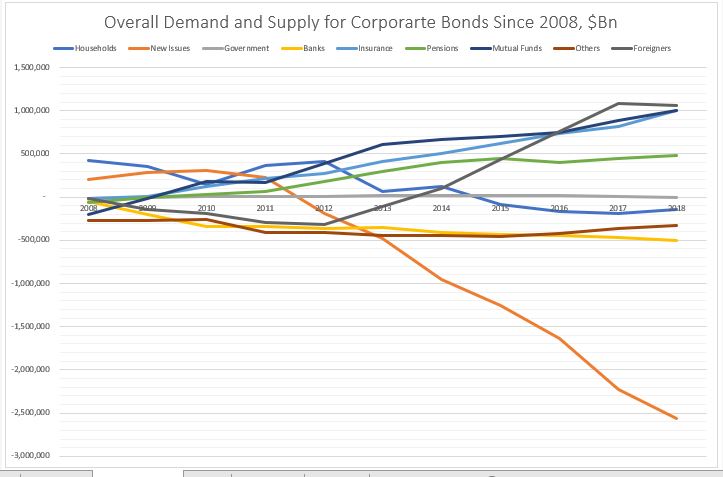
So, here it looks like foreigners, mutual funds and insurance companies ‘bought’ mostly at new issue or from the banks.
Finally, on the USTs side, everybody was a buyer. But the biggest buyer by large were foreigners. Mutual funds, pension funds, the Fed and households came, more or less, in equal amount, second. And then banks, ‘Others’ and insurance companies.

Kind of in a similar way, everyone here ‘bought’ at new issue.

Conclusion
It’s all about demand and supply.
In equities, real money has been a net seller in general, while the biggest buyer has been non-financial corporates themselves in the process of share buybacks. The financial sector has been a net issuer of equity thus its under-performance to the non-financial corporate sector. Equity real money flow is skewed mostly on the sell side.
Real money flow in corporate bonds is more balanced, but with a net buying bias.
USTs real money flow is skewed completely on the buy side.
Overall, since 2008 real money has sold equities, bought a bit of corporate bonds and bought a lot of UST: it does not seem at all that real money embraced the bullish stance which has prevailed in the markets since March 2009.
*Data is from end of Q4’08 till Q4’18, Source for all data is Fed Z1 Flow of Funds

Pingback: QE or not QE? Not QE, and not much liquidity either | BeyondOverton