This is money which has already been accounted for. The Fed did a liquidity and duration swap – out of UST coupons and MBS (mostly, some corporate credit) into T-Bills/reserves/deposits. That’s all. Ok, maybe some of that money will eventually go into risky assets, but why should it? If it wanted to, it would have gone even before the Fed swap. Obviously, it is not moving at the moment. It would have declined naturally after tax payments go though, but that could possibly be delayed again.
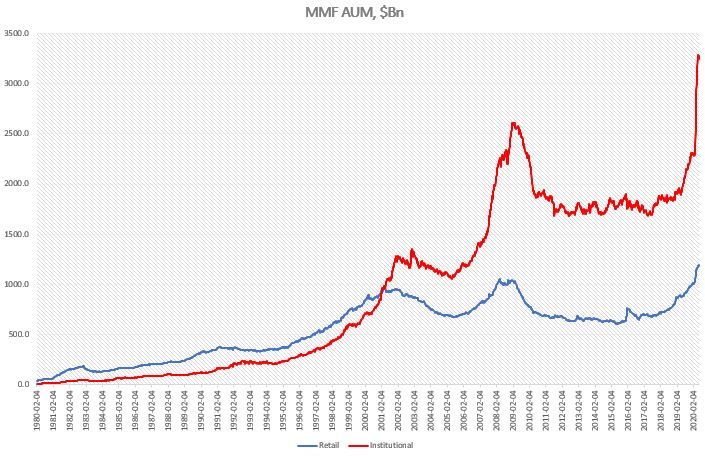
The only thing we see, is a flattening of the growth rate. Total AUM is back to early May level, which is where bank reserves have declined to as well. Again, that’s not surprising.
Is there money on the sidelines?
Yes, the only way to create that is to increase private sector net financial assets. Normally, this is done when the private sector receives income in exchange for work. In the early 1980s, this mechanism, unfortunately stalled, and the majority of the private sector income was generated in exchange of debt, which is kind of like money on the sidelines (net cash ‘creation’ through leverage), but it is a doble-edged weapon as that debt has an expiration and a positive interest rate. We are working on both the former – debt forgiveness, and the latter – interest rates are close to 0% now.
The only entity that can create financial assets without the debt liability, ‘money on the sidelines’, is the government: the Fed only lends money into existence, the Treasury spends it. This is exactly what the US government has done with the CARES Act: the SBA PPP could provide for about $600Bn of loan forgiveness ($112Bn of which has gone through) while the Recovery Rebates provide for about $300Bn of direct family assistance, no strings attached. This is not permanent, but it is an important step towards UBI/Helicopter money. This could change everything.
Despite the fanfare in the markets, the Federal Reserve’s monetary stimulus, on its own, is rather underwhelming compared to the equivalent during the 2008 financial crisis. What makes a difference this time, is the fiscal stimulus. The 2020 one is bigger than the 2008 one; but more importantly, it actually creates net financial assets for the private sector.
Monetary Stimulus
Fed’s balance sheet has increased by 73% since the beginning of 2020. In comparison, it increased by 109% between August’08, the month before Lehman went bust and most major programs started, and March’09, the month when the stock market bottomed. Actually, by the time QE3 ended, in September 2014, Fed’s balance sheet had increased by 385% compared to since before the crisis.
Commercial bank reserves were at 9% of their total assets before the Covid crisis and are sitting at 15% now, a 94% increase. In the aftermath of the 2008 crisis, on the other hand, bank reserves tripled from August’08 to March’09 and increased 10x by September’14. Relative to banks’ total assets, reserves were just at 3% before the crisis but rose to 20% by the end of QE3.
Bank deposits were at 75% of their total assets in January’20 and are at 76% now, a 17% increase. Deposits were at 63% before the 2008 crisis, had declined to 60% by March’09, and eventually rose to 69% of banks total assets. Overall, for this full period, commercial bank deposits rose by 49%.
In percentage terms, Fed’s balance sheet rose less during the 2020 crisis than during the 2008 crisis and its aftermath.
Commercial bank reserves were a much smaller percentage of banks’ total assets before the 2008 crisis than before the 2020 crisis, but by the end of QE in 2014, they were bigger than today.
Banks started deleveraging post the 2008 financial crisis (deposits went up as a percentage of total assets) and continue to deleverage even now.
On the positive side, however, the Fed has introduced four new programs in 2020 that did not exist in 2008, Moreover, unlike 2008, they are directed at the non-financial corporate sector, i.e. much more targeted lending than during the financial crisis.
Nevertheless, very little overall has been used of the facilities currently, both in absolute terms (the new ones), and compared to 2008.
In fact, looking at the performance of financial assets, the market is not only telling us we are beyond the worst-case scenario, but, as equities and credit have hit all-time highs, it seems we are discounting a back-to-normal outcome already. It took the US equity market about four years after the 2008 crisis to reach its previous peak in 2007. In the 2020 crisis, it took two moths!
Following the 2020 Covid crisis, monetary policy so far is much less potent than following the 2008 financial crisis. Taking into account the full usage of Fed’s facilities announced in 2020, the growth rate in both Fed’s balance sheet and commercial bank reserves by the end of 2020 will likely match those for the period Auguts’08-March’09. But it has a long way to go to resemble the strength of monetary policy during QE1,2.3. Given that US equities only managed to bottom out by March’09, in an environment of much stronger monetary policy on the margin than today, means that their extraordinary recovery during the Covid crisis has probably borrowed a lot from the future.
Fiscal Stimulus
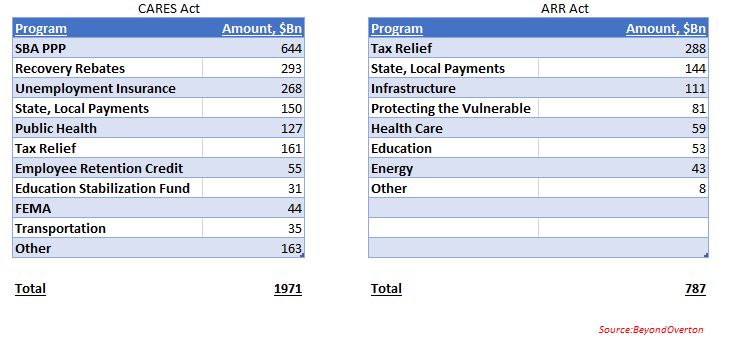
The Coronavirus Aid, Relief, and Economic Security (CARES) Act of 2020 is much bigger than the American Recovery and Reinvestment (ARR) Act of 2008, both in absolute terms and in percentage of GDP.
However, what really makes the difference, is the fact that the CARES Act has the provision to increase the private sector’s net assets. This is done through two of the programs. The SBA PPP allows for about $642Bn of loans to small businesses. If eligibility criteria are met, the loans can be forgiven. The Recovery Rebates Program allows for the disbursement of $1,200pp ($2,400 per joint filers plus $500 per dependent child). Nothing like this existed during the 2008 financial crisis.
Most of the loans through the SBA PPP have already been made, and about $112Bn are forgiven. So, there is another maximum of $532Bn which could still be forgiven (deadline is end of 2020). The Employment Rebate Programs is about $300Bn in size.
Just the size of these two programs can potentially be as big as the ARR Act was, in absolute terms. They create the possibility for the private sector to formally receive ‘income’, even though it is a one-off at the moment, without incurring a liability. Some of the other programs, like Tax Relief, are a version of that, but instead of acquiring an asset, the private sector receives a liability reduction – not exactly the same thing.
This is important. Until now, the private sector could receive income either in exchange for work, or, as it became increasingly more common starting in the late 1990s, with the promise of paying it back (in the form of debt). This now could be changing.
The Fed, for example, can not do that. Its mandate prevents it to ‘spend’ and only to ‘lend’. Until 2020, the Fed’s programs were essentially an exercise of liquidity transformation and a duration switch (the private sector reduced duration – mostly UST, MBS – and increased liquidity – T-Bills and bank reserves). There was no change in net assets on its balance sheet; the change was only in the composition of assets. The more recent programs introduced direct lending to the non-financial sector, still no net creation of financial assets, but a much broader access to the real economy.
In a sense, while the CARES Act comes closer to the concept of Helicopter Money or Universal Basic Income (UBI), the monetary stimulus of 2020 is moving closer to the concept of Modern Monetary Theory (MMT).
In that sense, while the reaction of financial markets to the monetary stimulus may not be deemed warranted, taking into account the innovative structure of the fiscal stimulus, asset prices overreaction becomes easier to understand. Still, I believe the market has discounted way too much into the future.
There is always a dichotomy between financial markets and the economy but, it seems that currently, the gap is quite stark between the two. It could be that the market is comfortable with the idea that, in a worst-case scenario, the authorities have plenty of ammunition to use, in the case of both the existing facilities as well as new stimulus.
Liquidity is getting tighter. The decline in Fed repos is simply a reflection of their increased cost. Therefore, we will know when things are really getting bad if repo volumes start to pick up. Finally, if the market expected to get a flush of liquidity towards month end from TGA, this is now less likely to happen.
First drop in overall Fed’s balance sheet since 02/26. And it is a rather large drop, $74Bn.
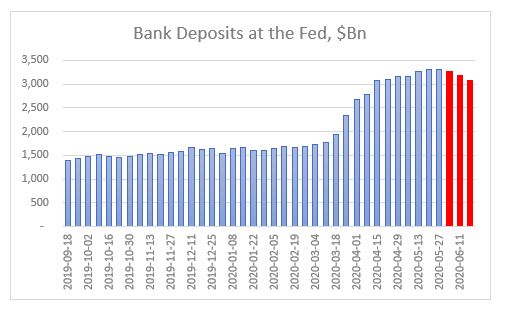
Third week in a row of declines in bank deposits. Level now is the same as 04/15. The 4-week rolling growth rate is now the lowest since the Fed’s U-turn last September.
TGA continues to climb to record highs despite some disbursements towards Fed’s SPVs as new programs get triggered. It is likely that the level of TGA depends on the amount of SBA loans drawn/forgiven and such TGA can stay above $800Bn, Treasury’s target, for some time.
CB swap lines decline by $92Bn – first large decline as some of them have matured and no additional USD funding required.
Net repos outstanding continue to decline – this has been a feature all of this week as both O/N and term repos have been 0 for USTs. Reason for that is Fed raised the minimum bid on O/N to IOER +5bps and on term to IOER +10bps. This was a surprise, not that it happened (Fed probably made that decision at its April FOMC already), but that it happened ahead of tax receipts day. Commercial banks now must step in to fill in the gap but with their deposits on decline, their flexibility is diminished.
Fed bought $83Bn of mortgages – that’s perhaps to compensate for net selling in the previous 3 weeks.
Extra liquidity is getting withdrawn. That’s it. Market is not in distress yet. For that, we will know it when Fed repo volumes start picking up again and O/N rates shoot up. But for sure, on the margin, there is less liquidity to go around. Markets are not reflecting this yet. Perhaps, waiting for a sign, that all this surplus liquidity has been withdrawn, to react.
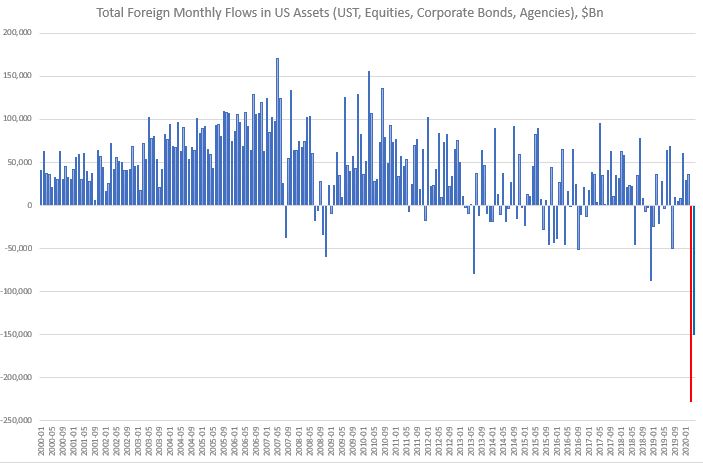
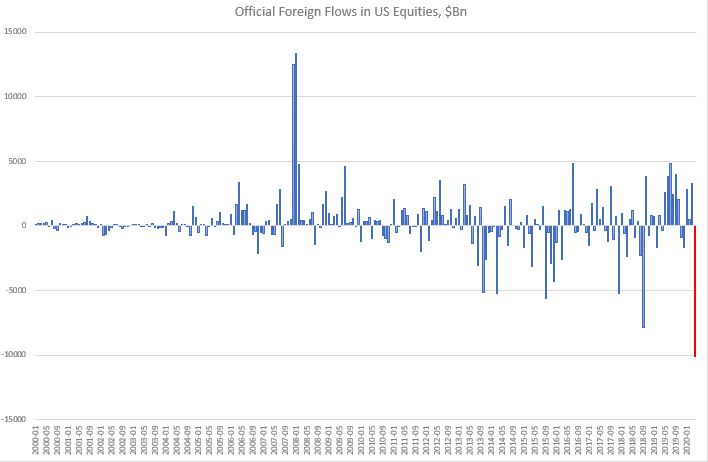
Foreign selling starts to pick up also in US equities and agencies.
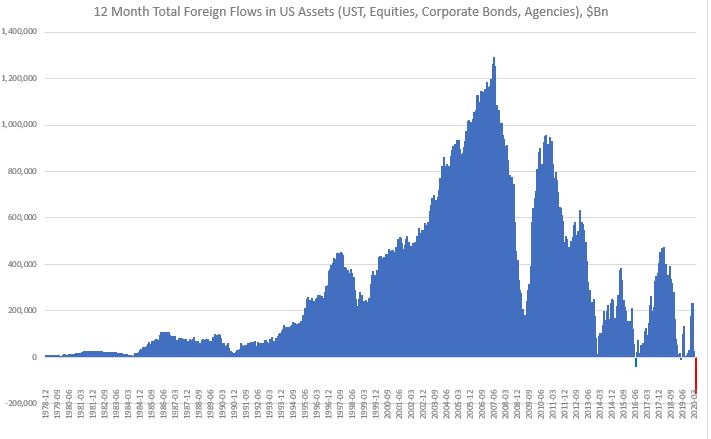
March broke the record for Total foreign monthly outflow.
This happened largely on the back of a record Private foreign sector outflow.
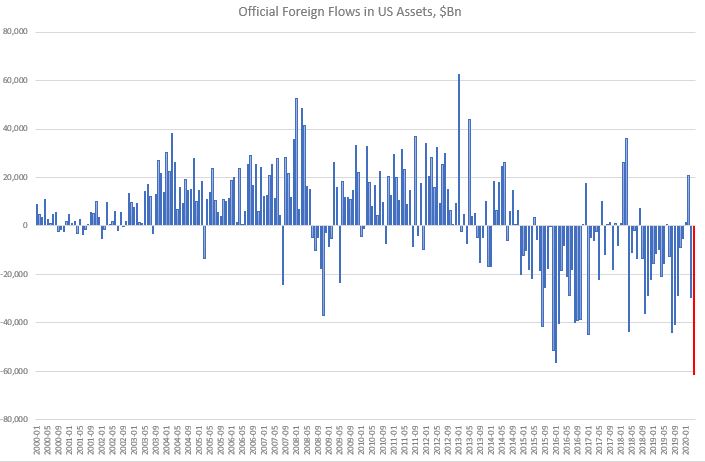
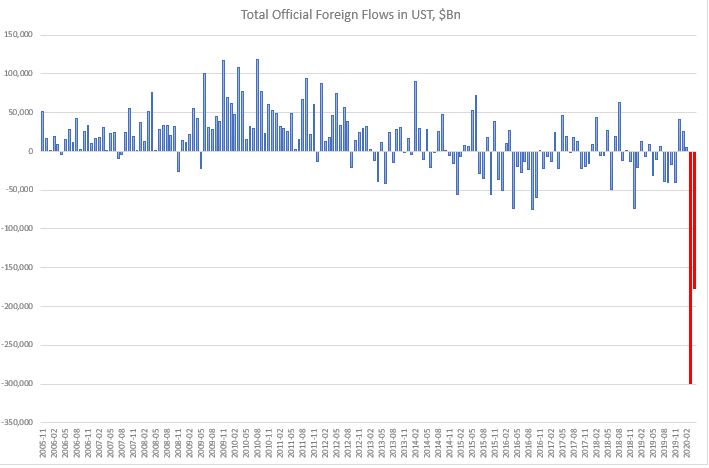
April still saw a large net foreign outflow, though not as big as March. Nevertheless, this time, the Official foreign flow reached an all-time low.
This is significant because the 12-month rolling cumulative total foreign flow in US turned negative by a large amount. This is very, very unusual.
Foreigners are still focused at the moment on selling primarily USTs.
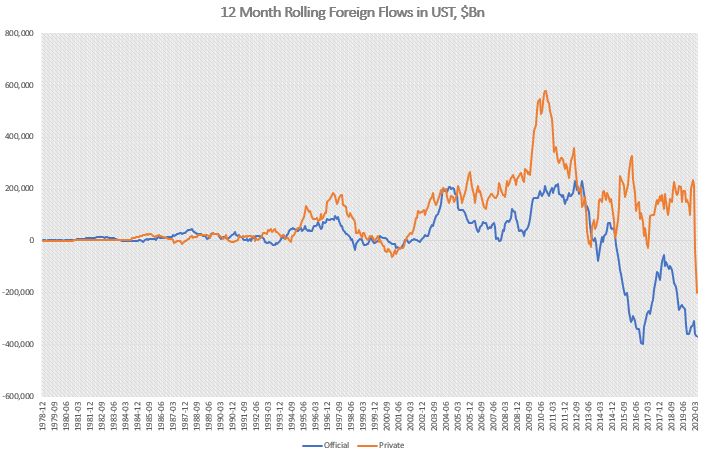
While in the past, private foreign accounts may have bought USTs even when official foreign accounts were selling, in the last two months (April-March), private foreign money turned sellers in size. In fact, their outflows have been several times bigger than the official foreign account outflows. This most recent selling put the 12-month rolling UST private foreign flow in negative territory in March. It reached an all-time low in April. The 12-month rolling UST official foreign money flow is also close to its all-time record low, reached in November 2016.
On the US equities side, unlike in March, though, this time foreigners were net sellers. The total outflow was not that large by historical standards, but the official foreign outflow was.
Foreigners continued to buy US corporate bonds, especially official foreign money. Nothing new there.
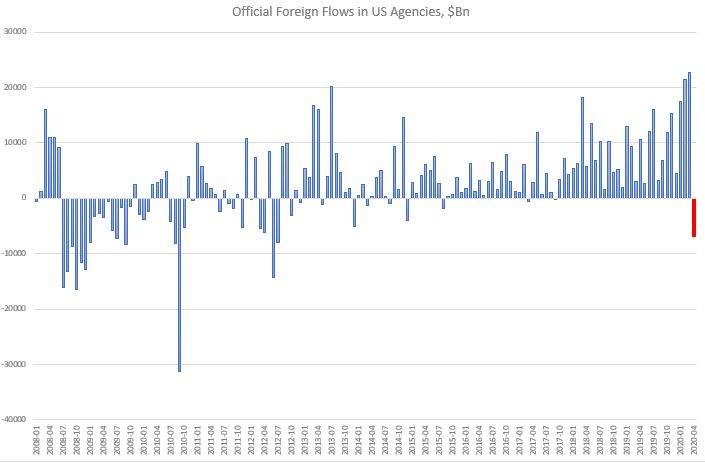
Finally, on the agencies side, official foreign accounts were a rather unusual and large seller.
Conclusion: The continuous high level of total foreign US assets outflows in April is interesting and could herald a change in trend of previous USD inflows. We can see that by looking at the rolling 12-month data which turned negative in March and is accelerating lower. In theory, there shouldn’t have been any forced pressure on foreign accounts to exit US assets in April, as Fed/Other Central Banks swap and repo lines were already in place. If this continues, the USD may be in bigger trouble than initially thought. See here, here and here.
“General Motors Corp. filed for bankruptcy protection, got kicked off the New York Stock Exchange and out of the Dow Jones industrial average. And its stock has mostly been rising ever since. In fact, GM has been one of the hottest issues on Wall Street over the last six trading sessions, surging from 61 cents totoday’s closing price of $1.59 in the electronic pinksheets.com market – a gain of 161%. (…) As I’ve written before, there’s a universe of traders out there who love to play around with big-name stocks that end up in bankruptcy. You can’t explain the action based on any fundamentals. It’s just a minute-to-minute, hour-to-hour trading game. (…) We know how this will end. But between now and then, for some gamblers playing GM is better than a trip to Vegas.”
“GM’s stock keeps trading but it is probably worthless” Tom Petruno, Los Angeles Times, June 10, 2009
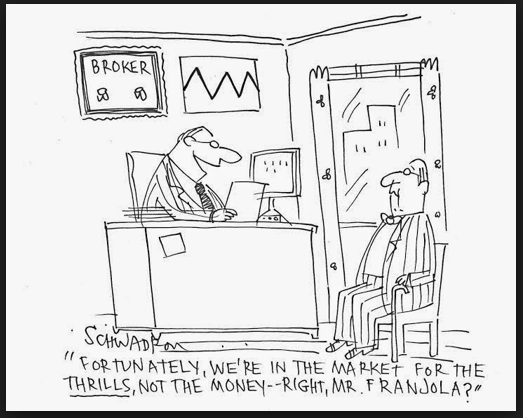
The price action in Hertz shares post-bankruptcy is quite normal (up to “Bankrupt Hertz granted approval to sell up to $1Bn in shares”, but that is another, important, story). The elevated activity of retail investors in trading the shares of bankrupt companies is a feature of this particular market. For a lot of them it ends badly, but most of them are doing it for the fun of gambling anyway.
I am not a bankruptcy expert or a bankruptcy lawyer and I have never been involved in a company restructuring (plenty of bond restructurings though). Let’s say that before Hertz, I knew nothing about bankruptcies. What I found fascinating with that recent episode, though, is that even people who should know about corporate bankruptcy (equity portfolio managers) did not know much either. I was intrigued by the Hertz case as it looked quite bizarre and indeed the price action seemed against all common sense.
As I embarked on researching the topic, it turned out that even the academic literature on this is quite scarce. Of course, there is a lot that addresses bankruptcy cases and issues but there is little on trading, valuations or performance of stocks which have entered bankruptcy. There are a few reasons for this perhaps. First, most bankrupt stocks are delisted from major exchanges before or around bankruptcy filings. Second, institutional ownership declines massively post-bankruptcy, with 90% of shares owned by retail thereafter. Third, research coverage drops as a result. And fourth, yes, the market for bankruptcy shares, it turns out, is quite inefficient, for example, very difficult to short (inability to source borrowing) and very wide bid-offer spread (all due to thin institutional involvement).
To do my research I relied extensively on two papers: 1. “Investing on Chapter 11 stocks: Trading, value, and performance” by Yuanzhi Li and Zhaodong Zhong 2. “Gambling on the market: who buys the stock of bankrupt companies?” by Luis Coelho and Richard Taffler. The below is my summary of some of the topics discussed in these as they pertain to markets.
There are quite a few misunderstandings about bankruptcy procedure. First, when companies get delisted, they don’t just disappear but continue to trade on the Pink Sheets, which is an electronic quotation system. Second, even though there are quite a few limitations, as mentioned above, trading activity is quite brisk. Third, it is quite common for prices to bounce immediately after bankruptcy announcements as institutional shareholders tend to choose to cover their shorts on the major exchanges than go through the Pink Sheets or indeed through the bankruptcy proceedings. Fourth, although in the majority of cases shareholders do get zero, there are precedents where shareholders gain, sometimes substantially, when buying the stocks immediately after bankruptcy announcements.
So, the fact that Hertz share price rose in these circumstances should not be a surprise given that the company was one of the most shorted stocks on the main exchanges for a number of years before. Moreover, it is quite common for share prices to rise immediately after declaring bankruptcy, even independent of short covering, on the back of a phenomenon called violation of APR (absolute priority rule) which occurs “when creditors are not fully satisfied before shareholders get any payments”.
There are two main reasons to do that. One is rational: there is value in buying cheap and deep out of the money call options on a company’s assets, operations, brand, etc. (some of them, some of the time, will pay off handsomely). There are examples of companies exiting bankruptcy with the original shareholders having gained from owning the shares from the day bankruptcy was officially announced.
The second reason is irrational. There is a massive non-linearity in the return: you get either zero or a lot. And who doesn’t like a cheap lottery ticket! The average price of bankrupt company shares is actually around $2 (yes, Hertz is well within that price range at the moment) in the month immediately post-bankruptcy, which to a lot of retail investors, looks, yes, irrationally, cheap.
“The human propensity to gamble seems to be able, at least partially, to explain why stocks of bankrupt firms continue to be actively traded by retail investor even after the formal announcement of bankruptcy.”
But don’t be deluded. There is only an ‘illusory profit opportunity’. The average return on holding the shares of bankrupt companies into the actual process of restructuring is a negative 28%. Limited possibility of short selling and not enough company disclosure, contributes to share prices reflecting a more optimistic scenario than actual reality and being much higher initially than, perhaps, ‘fundamental value’. That is why, there is a persistence of negative returns from a buy-and-hold strategy in bankrupt company shares: at the end of the bankruptcy proceedings, the true value of the stock is revealed. That does not mean though that buyers can not make money buying and selling the stock while still in the Pink Sheets.
Trading in the stocks of bankrupt companies whether immediately post-bankruptcy, as with Hertz, or in the Pink Sheets, is much more ‘suitable’ for retail investors, who, unlike institutional investors are more prone to overvalue risky assets and to prefer lottery-like payoffs. The current stock market activity, in general, was dominated by retail investors even before Hertz to an extent last observed probably during the dotcom boom. So, perhaps we are focusing too much on this phenomenon, and, in the process, exaggerating the effect retail investors have on the market, away from what that normally is.
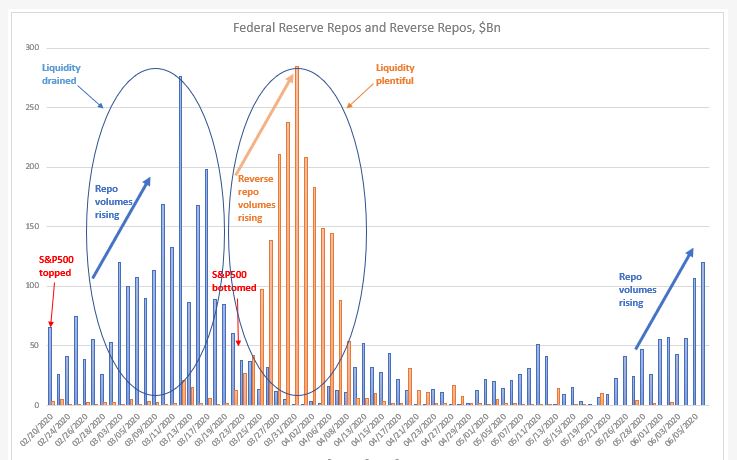
Repo volumes are rising in a similar fashion to the beginning of the crisis in February. Liquidity is leaving the system. Last two days, repos (O/N and term) rose above $100Bn. S&P500 topped on February 19 while repo volumes were about half of what we are seeing today. By the time we hit $100Bn in repos (March 3), the index had dropped 10%.
We had about two weeks (March 3-March 22) of repos printing about $128Bn on average per day. S&P 500 bottomed on March 23 as the Fed started stepping in with its various programs. Repos went down below $50Bn on average a day. More importantly liquidity started flooding the system. Reverse repos skyrocketed from $5bn on average per day to $143Bn a day by mid-April! Equities rallied in due course.
April/May, things went back to normal: repo volumes between $0Bn and $50Bn a day and reverse repos averaging about $2-3Bn a day->Goldilocks: liquidity was just about fine. Equities were doing well. Then in the first week of June, repos jumped above $50Bn, and last Friday and today they went above $100Bn. Reverse repos are firmly at $0Bn: they have literally been $0Bn for the last 4 days.
Again, just like in February, liquidity is starting to get drained from the system. By that level of repo volumes in March, equities were already 10% lower from peak. S&P500 is just a couple % below that previous peak, but Nasdaq is above!
I am not sure why the market is here. It could be that, in a perfect Pavlovian way, investors are giving the benefit of the doubt to the Fed that it will announce an increase of its asset purchasing program at this week’s FOMC meeting. If it doesn’t, US equities are a sell.
And don’t be fooled by no YCC or any forward guidance. The Fed needs to step in the UST market big way. YCC on 2-3 year will do nothing. Fed needs to do YCC on at least up to 10yr. As to really address the liquidity leaving the system, Fed needs to at least double its weekly UST purchases.
Fed is now probably considering which is worse: a UST flash crash or a risky asset flash crash. Or both if they play their hand wrong.
Looking at the dynamics of the changes in the weekly Fed balance sheet, latest one released last night, a few things spring up which are concerning.
1.The rise in repos for a second week in a row – a very similar development to the March rise in repos (when UST10yr flashed crashed). The Fed’s buying of Treasuries is not enough to cope with the supply hitting the market, which means the private sector needs to pitch in more and more in the buying of USTs (which leads to repos up).
This also ties up with the extraordinarily rise in TGA (US Treasury stock-piling cash). But the build-up there to $1.4Tn is massive: US Treasury has almost double the cash it had planned to have as end of June! Bottom line is that the Fed/UST are ‘worried’ about the proper functioning of the UST market. Next week’s FOMC meeting is super important to gauge Fed’s sensitivity to this development
2.Net-net liquidity has been drained out of the system in the last two weeks despite the massive rise in the Fed balance sheet (because of the bigger rise in TGA). It is strange the Fed did not add to the CP facility this week and bought only $1Bn of corporate bonds ($33Bn the week before, the bulk of the purchases) – why?
Fed’s balance sheet has gone up by $3tn since the beginning of the Covid crisis, but only about half of that has gone in the banking system to improve liquidity. The other half has gone straight to the US Treasury, in its TGA account. That 50% liquidity drain was very similar throughout the Fed’s liquidity injection between Sept’19-Dec’19. And it was very much unlike QE 1,2,3, in which almost 90% of Fed liquidity went into the banking system. See here. Very different dynamics.
Bottom line is that the market is ‘mis-pricing’ equity risk, just like it did at the end of 2019, because it assumes the Fed is creating more liquidity than in practice, and in fact, financial conditions may already be tightening. This is independent of developments affecting equities on the back of the Covid crisis. But on top of that, the market is also mis-pricing UST risk because the internals of the UST market are deteriorating. This is on the back of all the supply hitting the market as a result of the Treasury programs for Covid assistance.
The US private sector is too busy buying risky assets at the expense of UST. Fed might think about addressing that ‘imbalance’ unless it wants to see another flash crash in UST. So, are we facing a flash crash in either risky assets or UST?
Ironically, but logically, the precariousness of the UST market should have a higher weight in the decision-making progress of the Fed/US Treasury than risky markets, especially as the latter are trading at ATH. The Fed can ‘afford’ a stumble/tumble in risky assets just to get through the supply in UST that is about to hit the market and before the US elections to please the Treasury. Simple game theory suggest they should actually ‘encourage’ an equity market correction, here and now. Perhaps that is why they did not buy any CP/credit this week?
The Fed is on a treadmill and the speed button has been ratcheted higher and higher, so the Fed cannot keep up. It’s a dilemma (UST supply vs risky assets) which they cannot easily resolve because now they are buying both. They could YCC but then they are risking the USD if foreigners decide to bail out of US assets. So, it becomes a trilemma. But that is another story.