
Tags
The idea about this post came after listening to Ben Hunt’s and Ed Yardeni’s recent Ritholz Wealth Management podcasts. While, in general, I do agree with the conclusion Ben reaches, I thought looking at just two individual companies’ share buyback programs, as he did in two separate posts, is perhaps a bit too narrow. At the same time, I was doubtful whether Yardeni’s approach of going to the opposite extreme of looking at all S&P 500 companies and taking the average is equally that ‘practical’.
Ed Yardeni is a top strategist but his claim in “Exposing the big lie about stock buybacks” that the majority (2/3) of US stock buybacks go to cover employee stock issuance, even if true on an aggregate level, does not change the fact that buybacks are possibly the main driver of US stock out-performance.
According to Yardeni, some of the widely followed data shows the wrong number for stock buybacks. And the Fed seems to agree that its own Z1 Flow of Funds does not fully include issuance of shares to employees:
“The current source for equity issuance data in the Financial Accounts of the United States does not fully incorporate issuance to employees by public corporations. Staff is exploring how best to reflect such issuance activity in future releases.”
Emphasis on fully. What does this mean? Look at p.68, table F.223 of the latest Flow of Funds data. So, line 2 (‘Nonfinancial corporate business’) does not include ESOPs (and other equity compensation plans)? I don’t think that changes the demand-supply dynamics. Share grants are different from IPOs and buybacks as they are a non-cash flow item, as in the former there is no exchange of cash at issuance and the effect on the supply of shares happens only when those are sold by the employees in the secondary market. They are a balance sheet item. So mot likely, they will be registered either in line 16 (‘Household sector’) or in line 31 (‘Broker and dealers’) at the point of sale.
In any case, in the Flow of Funds data, ‘Net Issue‘ and ‘Net Purchases‘ have to balance, if we start tinkering with the net issuance (line 2), as in, assume that actually US corporates net bought back fewer shares to account for the ESOP (and other equity compensation programs), then we have to also change something on the net purchases side (line 15 and below). My guess is that ESOPs are incorporated in the Flow of Funds data but not in the net issuance section (with a positive sign), rather in the net purchases section (negative sign). I think this is the more likely scenario in what the Fed official meant as “not fully incorporating ESOP” in that data.
I could be wrong on this, so looking forward to some clarity from the Fed in the future publications of the Flow of Funds data.
I have no reason to doubt indeed that on average for all the companies in the S&P 500, 2/3 of share buyback activity goes towards avoiding dilution from share issuance on the back of employee compensation plans. However, this is not true for the largest corporate share buybacks programs in terms of dollar amounts conversion. And because of their market weight, this is where the big impact from buybacks on the S&P 500 comes from (on average, the price change of these companies’ share price is double that of the S&P 500 in the last 8 years).
If we take the 20 largest share buybacks programs and look at the same period 2011-2018 which also Yardeni data covers, employee stock compensation is only about 14% of the value of the corporate share buybacks. The ratios vary from company to company but just to give you an example, for Apple, which has, by far, the largest share repurchase program of all companies in the US, employee stock compensation is on average about 11% of total buybacks. The banks have the largest ratio, at around 35%, while Boeing and Visa have the lowest, around 4%.

Those large share buyback programs have reduced the companies share count by about 18% on average between 2011 – 2018. In some of the larger buybacks, like Apple, Pfizer etc., the share count is reduced by almost 25%. So, even if indeed some of the share buyback activity is on the back of employee compensation, there is still substantial reduction in the share count which should have an effect on share prices and on performance indicators per share.
ESOPs are actually not that prevalent in US businesses. In fact, only about 10% of the private workforce is involved in such programs and only about 10% of the publicly traded companies have them. Public companies, however, have other equity compensation programs but they are mostly geared to senior management. There are three kinds of equity awards that public companies give: restricted shares, share options and performance shares.
Share options had been the original and the most popular form of executive compensation until the mid-2000s or so. Their use was limited in the 1960-1970s, however, as the stock market languished and went nowhere (which is when companies started giving out restricted shares, which, even though they vest, they do not require either any upward movement of the share prices to ‘make money’ – as options do, or beating any performance targets – as performance shares do).
However, by the late 1990s, with the stock market rising substantially on the back of the financialization of the US economy which started in the 1980s with the doctrine of shareholder primacy and the accompanying surge of corporate share buybacks (SEC Rule 10B-18), the popularity of stock options surged to 75% of all executive compensation. By the mid-2000s, though, three things happened which affected adversely the use of stock options in executive compensation programs: 1) in 2006 the accounting rules changed, resulting in charge against earnings for the grant of options; 2) during the crisis of 2008, stock markets fell substantially; 3) The Dodd-Frank Act of 2010 now requires a say-on-pay vote. As a result, organizations such as Institutional Shareholder Services, now have a much greater influence over executive pay. Therefore, performance shares have become the dominant source of executive compensation.
There are two points I want to make here. First, the concern over exuberant executive pay is not something new – regulators have been looking into it since at least the 2000s. Second, because the performance targets are tied to companies’ EPS, the changes made to the executive compensation plans, unfortunately, fall short of their target: senior management can legally find a loophole to still continue to disproportionately increase their compensation. What do I mean ‘disproportionately’? I mean relative to other employees’ compensation and to companies’ top line growth.
Which brings me to a second claim made by Yardeni, namely that S&P 500 companies’ EPS growth is only about 1% lower than their total earnings growth. Again, I have no reason to doubt that, as a whole, this is correct: on average across all the S&P500 companies, there may not be much ‘smoothing out’ of EPS through share buybacks . But looking at the largest share buybacks programs, that’s not the case.
Of those, on average over the 2011-2018 period, top line net operational income growth is about half of EPS’s growth. What I found is that while top line income growth is somewhat similar to the average of the whole S&P 500 index (11.1% vs 8.1%), EPS growth in the largest share buyback companies was much higher.
Again, the numbers vary. For some (Microsoft, Nike), actually, average top-line growth is slightly higher than EPS growth. On the other spectrum, companies like Pfizer and Merck have had much smaller top line growth rates than EPS ones. Apple, having the largest share buyback program, has a more respectable 23% average annual top line operational income growth rate vs 27% EPS growth rate. But still very far from the average for the S&P 500 index company.
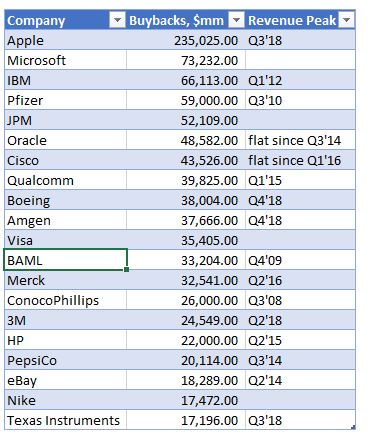
In fact, for majority of the companies in that sample, their revenues had peaked already some time ago. That did not stop companies continuing with their share buyback programs. In fact, some like Apple, Cisco, Amgen, BAML, Merck, Pfizer have substantially increased their spend on share buybacks thereafter.
Given the above, it is not unreasonable to assume that indeed senior management in these companies is ‘wrongly’ incentivized to authorize more buybacks despite lackluster top-line operational performance in order to benefit from the obviously better EPS performance.
But it is not all doom and gloom when it comes to share buybacks. Employment has risen on average by 26% over that period for those companies. However, that is really concentrated in a few big companies like Apple, Microsoft and Nike (for example, Apple has doubled its employment between 2001-2018). A lot of companies, the industrials (Pepsico, Merck, Pfizer, Texas Instruments) and the banks (JPM, BAML) have actually marginally reduced employment.
Finally, while it is reasonable to suppose that a lot of the increased activity in buybacks is linked to senior executives’ compensation packages, it is a lot more difficult to make the claim that they happen at the expense of R&D. For example, comparing Apple to Microsoft – massive difference when it comes to R&D spending vs buybacks. While Apple has spent a lot less on R&D vs buybacks in the last 8 years (in fact $175Bn less!), Microsoft has spent a lot more ($19Bn). And while Apple spends just about 3% of its revenue on R&D, Microsoft spends about 13%.
There is a divergence among the industrialists as well, with Texas Instruments, Boeing and Amgen spending substantially more on buybacks relative to R&D, while Pfizer, Merck and Cisco have spent substantially more on R&D than on buybacks.
What’s the right way to analyse US share buybacks? I don’t think there is one right way. Ben Hunt has done great investigative work looking at a couple of the large corporate share buybacks. Ed Yardeni has done the same looking at the whole S&P 500 index. I have taken the middle road by looking at the 20 or so largest share buybacks. Probably each one of these three approaches is prone to some selection bias geared to the conclusions one may want to reach!?
From being a niche discussion and research topic when I first started looking at it in 2015 to being now in the popular media on a daily basis, share buybacks do deserve this attention because they could be potentially affecting things like income and wealth inequality, corporate investment, employment, productivity, economic growth, etc. So, it is only good if more and more people look at the the numbers to try to figure what exactly is going on.

I love how much information you include in your posts! It takes real talent to write that much on a topic such as this!
Pingback: Brace your horses, this carriage is broken | BeyondOverton