
Tags
ETFs are not like subprime CDOs but they come close. Direct access to the Fed’s balance sheet will become essential for fund managers’ survival during the next financial crisis.
According to Bloomberg Magazine, the largest asset managers in the world, BlackRock, Vanguard and State Street, hold about 80% of all indexed money.
“Some 22% of the shares of the typical S&P 500 company sits in their portfolios, up from 13.5% in 2008…BlackRock, Vanguard, and State Street combined own 18% of Apple Inc.’s shares, up from 7% at the end of 2009… The phenomenon can be even more pronounced for smaller companies.”
This high concentration is the most serious danger to stock market bulls. Though, it is not obvious what the trigger for a market decline could be, when it happens, the present market structure could make it a much worse experience than the 2008 stock market decline.
Unlike 2008, however, the risks are on the buyside and the market doesn’t seem leveraged. But like 2008, the Fed is probably in the dark to the actual risks in the system, because the buyside is like shadow banking: no one knows what is going on/off fund managers’ balance sheets. Like the broker-dealers of pre-2008, the buyside today does not have access to the Fed’s balance sheet. The Prime Dealers Credit Facility (PDCF), which allowed access to borrowing from the Fed, was only created after Bear Stearns ‘failed’. Still, PDCF did not help Lehman Brothers, even though the latter did have good collateral at hand.
The buyside now may not be leveraged that much indeed but the extreme concentration of positions leads to the same effect on liquidity under stress as in 2008. This concentration is worsened by the fact that ETF sizes are many times larger than the underlying assets/markets in many cases. And though in 2008 broker-dealers ‘could’ possibly get some liquidity if they had good collateral, now the interbank market is much trickier as banks are in a regulatory straitjacket and it is not obvious (barring de-regulation) how they can provide much more liquidity even under normal conditions.
Does this make ETFs as dangerous as subprime CDOs of the 2000s indeed? I don’t know, but it makes them not that different at the same time. For example, we know that at least 40% of S&P 500 companies are money losing and we know that there is very high concentration of risk in them as per the Bloomberg Magazine article above (for comparisons, the percentage of subprime mortgages in 2000s CDOs varied between 50% in 2003 to 75% in 2007).
There are also similarities in the way the two markets emerged. In the late 1990s the Clinton administration decided not only to close the budget deficit but to also run a surplus. Bad things happen in financial markets when the US runs a budget surplus and reduces the flow of safe assets (thankfully, it does not happen often). The market responded by creating fake safe assets, like (subprime) CDOs.
In a similar fashion to the US Treasury actions of the late 1990s, US corporates have been buying back their shares, significantly reducing US public share count in the process. As the financial sector kept growing, it was starved of options where to put its money. How did the market respond? Fund managers (mostly, but also some banks) started creating ETFs. Just like CDOs, with the ETFs you buy the pure-bred stallions and the broken carriage as a package – you don’t have a choice. And as the passive/indexing trend spread, concentration soared further.
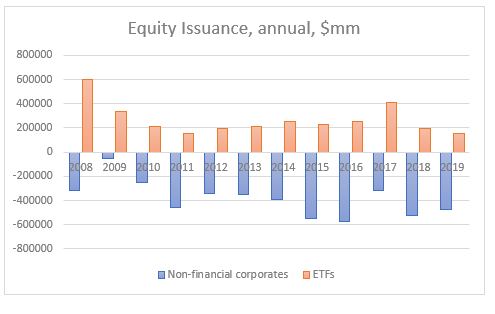
Non-financial corporate issuance has indeed been negative (corporates bought back shares) since 2008 at $4.6Tn, cumulative, but ETFs issuance is a positive $3.2tn. So, net there is still a reduction in public equity flow but nothing as dramatic as some sell side analysts claim (excluding US equity issuance abroad – see below).
And the flip side of that is retail, which has indeed been selling equities direct but also buying indirect through ETFs – so, similarly, households have sold equity risk down but not as much as claimed – in a sense, retail buying is ‘masked’ in the flows (it is simply an incomplete ‘wash’ from owning equities direct in an active form to owning equities indirect in passive ETFs).
Actually, in 2019 households bought the most equities direct since the crisis. Foreigners and mutual funds, on the other hand, sold the most equities since the crisis. And equity issuance was the most negative (in the chart below, it is shown as a positive number to signify equity share buybacks).

Equity issuance above is comprised of non-financial corporate, ETF and new issues abroad. When most sell side analysts report share buybacks, they only take into consideration net domestic non-financial corporate issuance. But ETFs and new issues abroad also matter from a flow perspective. The big change in 2019 was, in fact, the new issuance abroad which was negative – the last time it was negative was in 2008 (the data for 2019 is as of Q3, but it is annualized for comparison purposes).
Unlike 2008, however, it is not obvious to me where the trigger for the unwind of the ETF flow would come from. With the CDOs it was ‘easy’ – all it took was for rates to rise to ‘cripple’ both the mortgage payer and the leveraged CDOs owner. The debt overhang today is actually even bigger than in 2007, but the Fed’s failed experiment between 2016-2018 pretty much assures rates will stay low for the foreseeable future. Still, even though there is not much leverage in the system now, the high concentration of risk could produce the same effect on liquidity as if there were. But you still need a ‘seller’ to start the carriage rolling down the hill, don’t you?
This seller could be retail as an unwind of the 2019 inflow. Or the ‘selling’ could come from US corporates themselves (in the form of less buying back of their own shares – or no buying at all as a response to a regulatory change – but the latter is a 2021 event, post US presidential election, most likely). Or it could be a natural decline in share buybacks as a response to a drop in corporate Free Cash Flows (FCF) on the back of top-line revenues having peaked already (for the 17 out of 20 largest share buyback companies that is indeed the case).
The need for liquidity from fund managers is unlikely to be provided by the banking system, which is even now, without any stress, constrained by Basel III regulations to expand sufficiently its balance sheet. The Fed could be either forced to start buying equities to stem the slide and allow fund managers to meet redemptions, or it could extend a direct line of liquidity to them in a similar fashion to the creation of PDCF in 2008 for the primary dealers. My bet is on the latter as a politically more acceptable solution.
No financial crises are alike but a precondition for all of them is an extreme build-up of either economic or structural market imbalance. The next crisis is more likely to be a function of the latter one, namely high concentration of risk in institutions without direct access to liquidity from the Fed.
As for the trigger for the crisis, we can only speculate. Anyway, there isn’t usually one trigger per se but rather a combination. And we are only meant to figure that out in retrospect. But it is important to do away with two wrong narratives. First, that retail accounts have been large sellers of equities, and second, that the supply of equities has been hugely negative.
This note showed that neither of them holds water. ETF flow is at the core of the matter here. On one hand, it has facilitated the issuance of plenty equity-like instruments to make up for some of the lack of direct equity issuance, and, on the other, it has allowed retail to partially switch from active and direct equity management to passive and indirect one. In doing so, it has created the said market imbalance.
ETF, WTF.
