• About
  • BeyondOverton Travel
    • Silk Road (1): If Turkey is in crisis, it’s not obvious visiting it
    • Silk Road (2): Could beautiful nature and ancient history create a false sense of entitlement?
    • Silk Road (3): Fast Car
    • Silk Road (4):We took a bus ride to Iran
    • Silk Road (5): Border bothers
    • Silk Road (6): Chevrolet Land
    • Silk Road (7): Free-roaming camels and wild horses
    • Silk Road (8): China West to East
    • Silk Road (9): I have not told half of what I saw
  • BLOG
  • g88kboy Travel
    • On the Silk Road
    • Bulgaria : The Chicken crossed the Road
    • Turkey : The Country, not the Bird
    • Georgia on my Mind
    • Armenian Ayran
    • Iran – The Curious Land
    • An American in Azerbaijan
    • Uzbekistan: Golden Teeth and Neon Signs
    • Kazakhstan: Thirty Sweating Seniors
    • China Part One – Pandas Are Extinct
    • China Part Two: My TED Talk (Deep Analysis)
    • Phillipines – They Relax, I (pretend to😉) Study
    • Singapore: flashing trees and a torrent of tears
    • Malaysia: That ain’t no croc, it’s a log
    • Brunei: The Instinctive Fight for Superior Domination
    • Phillipines: Hello Friend Again
  • Outside the window
    • Bulgaria
    • Turkey
    • Georgia
    • Armenia
    • Iran
    • Azerbaijan
    • Uzbekistan
    • Kazakhstan

BeyondOverton

~ let's move this window

BeyondOverton

Monthly Archives: October 2019

Share buybacks: a question of framing within the rule of law

31 Thursday Oct 2019

Posted by beyondoverton in Equity, Politics

≈ Leave a comment

Tags

SEC Rule 10B-18, share buybacks

‘Banning’ buybacks won’t help, say the experts! Of course, it would, but you have to do it within the context of reversing shareholder profit maximization.

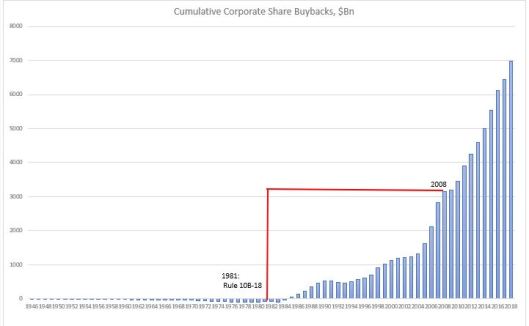
The SEC Rule 10b-18, which provided a ‘safe haven’ for share buybacks (they were never actually illegal), came into being in 1982. But the fertile ground of financialization and shareholder primacy thinking was already laid down in 1979. The theoretical ideas actually started fermenting even before, in 1932, with A. Berle’s and G. Means’ “The Modern Corporation and Private Property”, and culminated with “The Friedman doctrine” in 1970.

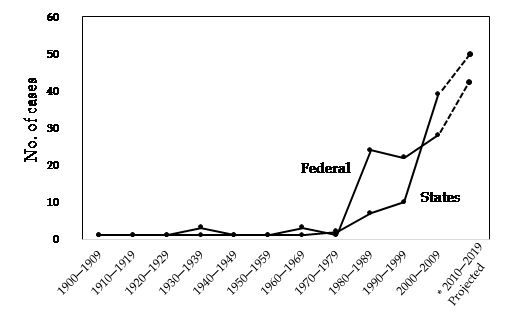
There is a huge misunderstanding about share buybacks before and after SEC Rule 10b-18. Buybacks were not ‘illegal’ before 1982, but the courts would generally be harsher on the interpretation of why they were conducted. Therefore, few companies attempted them. And it had all to do with the thinking behind ‘what is the purpose of a corporation’. For example, in the period 1900-1979, “courts were virtually silent on the idea of profit maximization”*. However, starting in the mid-1980s, this changed dramatically.

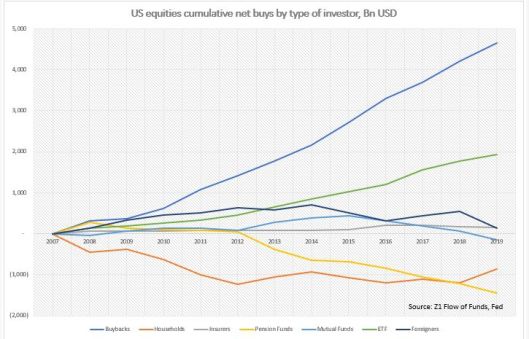
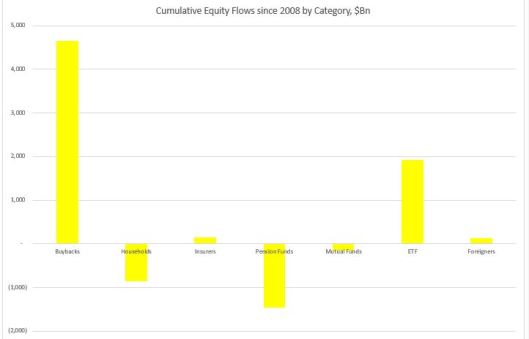
What followed was a spur of financialization, share buybacks and frantic M&A activity, all in line with finding innovative ways to reward shareholders. This resulted in a drastic decline in publicly traded US companies and the ‘oligopolization’ of US economy. Something which was undeniably good for shareholders became also questionably not so good for the economy and for everyone else, who is not a shareholder. In fact, the percentage of Americans who own shares in publicly traded companies has also declined in the process.

Shareholders primacy is often described as a ‘doctrine’, i.e. a mere belief system, when, in fact, it is much more than that. It is a “judge-made law” which means that “these varying levels of judicial embrace across many jurisdictions and over a long period have legal and jurisprudential significance.”*

This is important to understand. SEC Rule 10b-18 is not a law, but a rule within a complex maze of judicial proceedings and interpretations. Reversing that rule in isolation will do no good indeed as CEOs will find other way to return money to shareholders and they will be not only justified to do this by the corporate incentive system but also protected by the system of law. But reversing this rule in the context of questioning the point of shareholder profit maximization is a must.

And, just like in the early 1980s when it was first introduced, the fertile ground of reversing it has already been laid out a few years ago by the writings of people like William Lazonick, Lynn Stout and a few others. Having put this issue on Washington’s agenda, we may be indeed reaching an inflection point at next year’s presidential election.

*”A Legal Theory of Shareholder Primacy”, Robert J. Rhee

Negative interest rates may not be a temporary measure

29 Tuesday Oct 2019

Posted by beyondoverton in Debt, Monetary Policy, Politics

≈ 2 Comments

Tags

demurrage, negative interest rates

In the current debt-backed system, the majority of money is still loaned into circulation at a positive interest rate. Even in Europe and Japan, where base interest rates and sovereign bond yields are negative, the majority of private debt still carries a positive interest rate. This structure inherently requires a constantly growing portion of the existing stock of money to be devoted to paying solely interest. Thus, the rate of growth of the money supply has to be equal to or greater than the rate of interest, otherwise more and more money would be devoted to paying interest than to economic activity.

The long-term average growth rate of US money supply is around 6%, which is only slightly higher than the average interest rate on US government debt but it is below both the average US corporate interest rate and US household debt. While I have used the UST 10yr yield as the average yield on US government debt (the average maturity of US debt is slightly less than that), the estimates for both US corporate debt and US household debt are very generous. For the former, I used the average yield on Aaa and Baa corporate bonds, and for the latter I used a weighted average interest rate between mortgage debt and auto loans (I have used 2/3 and 1/3 weights). I have not included the much higher yield on US corporate junk bonds which comprise a growing proportion of overall corporate debt. I have also not used credit card/consumer debt, which has a much higher interest rate than auto loans, and also student loan debt which carries approximately similar interest rate to auto loans. Just like for BBB and lower rated US corporates, credit card and student loan debt are a much higher proportion of total US household indebtedness compared to before the 2008 crisis.

I estimate the long-term average economy-wide interest rate as a weighted average of government, corporate and household debt – with the weights being their portions of the total stock of debt. That rate currently is about 7%, still higher than the average money supply growth rate since the early 1980s. Over the last four decades, US money supply has not only not grown enough, on average, to stimulate US economic growth, but has been, in fact even, below the overall interest rate in the economy. Needless to say, this is not an environment that could have persisted for a long time.

Indeed, if one calculates the above equivalent rates for the period 1980-2007, the situation would be even more extreme (see Chart below). In fact, until the late 1990s, money supply growth had been pretty much consistently below the economy-wide interest rate. Only after the dotcom crisis, but really after the 2008 crisis, money supply growth rate picked up and stayed on average above the economy-wide interest rate.

What is the situation now? The current money supply growth rate is just above the average economy-wide interest rate; respectively above the government and corporate interest rates but below the household interest rate (data is as of Q1’2019).

It is also still below the combined average private sector interest rate.

So, even at these low interest rate, US money supply is just about enough to cover interest payments on previously created money. And that is assuming equal distribution of money. Reality is that it is only enough to cover interest payment on public debt. And even in the private sector, money distribution is very skewed: corporates have record amount of cash but it is only in the treasuries of few corporates. The private sector, overall, can barely cover its interest payment, let alone invest in CAPEX, etc.

The deeper question is whether money creation should indeed be linked to debt at positive interest rate. In fact, we have already answered that question, and gone beyond, with some portion of money creation in Europe and Japan actually happening at negative interest rate. In effect, the market is trying to correct for all those decades when money creation substantially lagged interest payments: money there is starting to decay.

Demurrage money is not unusual in history. Early forms of commodity money, like grain and cattle, was indeed subject to decay. Even metallic money, later, on was subject to inherent ‘negative interest rates’. In the Middle Ages, in Europe, coins were periodically recoiled and then re-minted at a discount rate (in England, for example, this was done every 6 years, and for every four coins, only three were issued back). Money supply though, did not shrink, as the authorities (the king) would replenish the difference to find his own expenses. In 1906, Silvio Gesell proposed a system of demurrage money which he called Freigeld (free money), effectively placing a stamp on each paper note costing a fraction of the note’s value over a specific time period. During the Great Depression, Gesell’s idea was used in some parts of Europe (the wara and the Worgl) with the demurrage rate of 1% per month.

The idea behind demurrage money is to decouple two of the three attributes of money: store of value vs medium of exchange. These two cannot possibly co-exist and are in constant ‘conflict’ with each other: a medium of exchange needs to circulate to have any value, but a store of value, by default, ‘requires’ money to be kept out of circulation. Negative interest rates in effect split these two functions.

Seen from this point of view, negative interest rates may not be a temporary phenomenon just to spur lending. On the opposite, negative interest rates may be here to help reduce the overall debt stock in the economy and to escape the deflationary liquidity trap caused by the declining marginal efficiency of capital.

Pension fund crisis?*

24 Thursday Oct 2019

Posted by beyondoverton in Debt, Politics, Questions

≈ Leave a comment

Tags

pensions

At presentations you will see the blue line below.

How many times have you seen the red line?

Pension funds unfunded liabilities have indeed been on the rise, especially after 1999. But so have pension funds assets. So much, that the ratio between the two has been declining (which is the natural, long-term trend) since 2008.

In fact, for the whole period between WW2 and 1984, unfunded liabilities were always bigger than funded liabilities. In 1999, unfunded liabilities hit an all time low of 25% of funded liabilities and even though that ratio has risen since then to 75%, it is still much closer to the bottom of the whole period since 1945.

So, is there a pension fund crisis?

Maybe, but it is not obvious to me that it is anything bigger than at any other point in history before the 1990s.

Could there be a pension fund crisis?

Of course. But you know what is going to happen (as long as the US is fully sovereign), the Treasury will bail out the pension fund industry just as it bailed out the fund management industry in 1988 following the Asian/Russia crisis, and the banking, insurance and auto industry following the 2008 financial crisis.

This, sadly, does not prevent that future pensioners might be exposed to some misguided government attempts to respond to this supposed pension fund crisis by extending the retirement age.

Bottom line is that 1) pension funds unfunded liabilities are not even close to being in a crisis and 2) any fully sovereign government is in a position to provide all the necessary resources to secure comfortable retirement to its people.

We have advanced as a society to such an extent that the only hurdle to a normal life to all at the moment is our antiquated rules of accounting, not our lack of resources.

*Betteridge’s law of headlines: “Any headline that ends with a question mark can be answered by the word no.”

The best portfolio diversifier

24 Thursday Oct 2019

Posted by beyondoverton in Asset Allocation, EM

≈ 2 Comments

Given low, and in some countries negative sovereign rates, are sovereign bonds still the best portfolio diversifier in the long run? 

Yes

Because the portfolio optimization function has also changed. We are moving away from a world of profit maximization to a world of loss minimization.

Given persistent and large output gaps and surplus capital in the developed world, the expected return on future capital investment should be negative.

If Japan, Switzerland, Sweden and Denmark are any guide, their respective stock markets are down or flat since rates hit 0%. US is still a massive outlier (buybacks) but that is also fading (SPX buyback index is down YTD).

From a long-term point of view, I would still own sovereign debt as it has superior risk-adjusted returns even at these low yields. For example, in the last bear market for bonds, 10yr UST went from 1.95% in 1941 to 14.6% in 1982. Annual real total return for the period was 0.4% (annual nominal return was 5% with Sharpe ratio of 0.54). There were 10 years of negative returns (24% of the time) with the largest drawdown of 5% in 1969. In the bull market that followed, annual real returns were much higher but that was only because of disinflation (nominal returns were only marginally higher – around 6%). We still had 6 years of negative returns, but the largest drawdown was 11%.

‘Bond bubble’ is an oxymoron. The best value on the curve now: T-Bills. If you could be bothered to roll them, they would have a similar return to the long end but much lower volatility. The Fed just announced it is in the market buying T-Bills (as it ‘should’: the Fed is massively underweight T-Bills vs both history and the market). Despite heavy Treasury issuance net supply of T-Bills is expected to be negative next year.

US retail is massively underweight USTs: about 3-5% of all financial assets and about 2% of their overall assets.

Is gold a better portfolio diversifier when sovereigns yields are negative? Perhaps, in the short term and only for retail. Long-term, expected return on gold should also be negative (as long as sovereign yields are negative). For institutional investor gold is an inferior option from a liquidity and regulations point of view.

Is there a better portfolio diversifier at the moment, short-term? Perhaps soft commodities which trade below production costs (for some, like cotton, wheat – substantially below) – compare to precious metals which trade 50% above marginal cost of production. 

Soft commodities might be the exception among the major asset classes, whereby expected return is actually positive in a negative sovereign yield world, given that they already experienced negative returns in the past 10 years and their zero (negative?) weights in institutional or retail portfolios (mean reversion).

One can go even fancier here, up the risk curve, and allocate to hard currency emerging market debt, which has had even better risk-adjusted returns than USTs over the last 3 years. And, depending on currency views, go even further into local currency (unhedged) emerging market debt. USTs do not need to be negative, just to hover around 0%, for emerging market debt to really outperform, assuming no major market dislocation.

Finally, on the equity side, some allocation to emerging markets equity is also probably warranted given their massive under-performance specifically to US equities and my projected negative returns of the latter going forward. Unlike their developed market counterparts, emerging markets are not running negative output gaps and therefore, capital is still expected to earn a premium there.

Bottom line: if we are indeed in a loss-minimization type of world when it comes to investment returns (note, this does not assume any kind of market crash) one is still better off staying in sovereign debt, even when it yields negative as every other liquid asset is bound to return even more negative on any reasonable time scenario.

The 60/40 portfolio is a myth

24 Thursday Oct 2019

Posted by beyondoverton in Asset Allocation

≈ Leave a comment

Tags

Debt, Equity

-US households balance sheet is comprised roughly of 70% financial assets and 30% real assets. That mixture has actually been relatively stable throughout the post WW2 period.

-The non financial side of the balance sheet is comprised of 80% real estate and 20% ‘goods’ (car, furniture, etc.). Since WW2 there has been a gradual increase in the real estate portion from 70% of total to about 85% in 2007.

-The biggest item on the financial side of the portfolio is the pension fund (PF) allocation at around 30% of total. This was not always the case. In fact, it has gradually grown from 9% in 1945.

-The second biggest allocation is to equities (EQ) direct at around 18%, which turns out to be the average for the whole period post WW2. The highest allocation was in 1999 and 1965 at 28%, the lowest in 1984 at 10%.  Households own equities also indirect through their pension and mutual funds.

-The third biggest allocation is cash at 15%, 17% being the average in the post WW2 period, 25% the highest in 1984, and 12% the smallest in 1999.

-The fourth largest allocation is to mutual funds (MF) at 9%. Just like with PF, this allocation has increased gradually from pretty much 0% before the financial liberalization of the early 1980s.

-Fixed Income (FI) direct only comes fifth here at 6%, average 7%, highest 11% in 2008, smallest 5% in 1972. Households also own fixed income indirectly through their pension funds.

-The FI portfolio is comprised of USTs, agencies, munis and corporate debt. Munis have the largest allocation at around 39% followed by USTs at 33% corporates at 19% and agencies.

-the FI portfolio looked very different in the early days with the bulk of the exposure in USTs (84%), corporates (11%) and munis (5%). Agencies exposure kicked in only in the late 1960s.

-US households also own their own businesses (non-corporate equity – NCEQ) which used to be their largest exposure immediately in the early days post WW2 at 31% but has gradually halved by now.

-If we add cash and loans (very small exposure) to FI, the FI allocation overall goes to 23%. If we add the MF exposure to the Equities exposure, the latter goes to 27%. Life insurance (LI) and ‘Other’ comprise the remaining 5%.

-If we extract the PF exposure to its respective allocation to the different asset classes, the overall ‘concise’ US household portfolio has these weights at the moment: FI-30%, EQ-40%, NCEQ – 15%, LI/Other – 15%.

These are the trends in equities from the Fed’s Flow of Funds

24 Thursday Oct 2019

Posted by beyondoverton in Equity

≈ Leave a comment

1.Net cumulative real money equity flow (households, mutual funds, pension funds, insurers and ETFs) is down almost $400Bn since 2008.

2.There is a clear trend obvious above of switching from active equity management (households, mutual funds, pension funds, insurers) to passive (ETFs).

3.The only real buyer of equities since 2008 are non financial corporates themselves. Although, to be fair, the domestic financial sector has been a large issuer of equities, especially immediately post 2008, offsetting some of the demand from corporates. Bottom line is that since 2008, very generally speaking, real money has been selling equities into a corporate bid.

4.Share buybacks started in earnest only after SEC Rule 10B-18 was introduced in 1981. Until then corporates were net issuers of shares (supply increased). After 1983, on a cumulative basis, corporates became net buyers of equities (supply shrank). From 2008 onwards, corporates bought back more shares than for the whole period before.

5.Households have been reducing their direct holdings of equities. From 1946 till the early 1990s they moved from owning direct to owning equities through their pension fund. From 1990 till 2000 they expanded also in mutual funds and as a result, the growth of pension funds’ exposure to equities slowed down at the expense of mutual funds growth. And from 2000 till now they have been switching further into owning equities through ETFs at the expense of all of the above.

6.Since 2008, cumulative equity inflow from insurance companies and mutual funds is more or less flat. Pension funds divested from equities at the expense largely of ETFs.

7.Equities inflow from foreigners really picked up after 2000s but peaked in 2014.

Repo squeeze and the Fed: two additional solutions

04 Friday Oct 2019

Posted by beyondoverton in Monetary Policy, Politics

≈ Leave a comment

Tags

Fed

Things the Fed can do to alleviate the potential repo squeeze (apart from the usual suspects already discussed in great detail by both saleside/buyside research and in Twittersphere):

1) hike the interest banks pay on TT&L ‘notes’ accounts from EFF-25bps to EFF, or to make it even simpler, equal to IOER. That could encourage funds to move from the TGA account back to TT&L accounts and ‘release’ reserves.

When the Fed started paying IOER, the opportunity cost for the Treasury to keep money on deposit in the banking system (TT&L accounts) rose. The Treasury thus started using the TGA at the Fed.

2) cut the fee on daily uncollateralized overdrafts from the current 50bps, adjust the net debt caps, decrease the penalty daily overdraft fee of 150bps. That could encourage better use of the existing Fed intraday liquidity option.

The Fed made major changes to its daily overdraft operations in 2011 spurred by some inexplicable desire to limit its credit exposure. This was probably on the back of political pressure from the legacy of the 2008 crisis during which the Fed indeed took massive credit risk.

Before 2011, the majority of the Fed’s daily overdrafts were uncollateralized. The new rules discouraged uncollateralized ‘repos’ by raising their fees and introducing collateralized overdrafts for free. After those changes, majority of the overdrafts became collateralized. The problem arose when during the most recent repo squeeze, the mechanics of obtaining collateral became complicated.

In any case, Fed’s action was strange given the fact that only a few months before that, in 2011, it had changed the accounting rules which pretty much ensured that the central bank can not go bankrupt (no negative equity) even in theory.

Should the Fed, actually, be providing free intraday liquidity with no collateral to eligible institutions? I think so. Because:

-that liquidity is needed for transaction (retail 24/7), not consumption or production purposes (Pfister 2018)

-the central bank can create money at zero cost, while the opportunity cost of holding money should be equal to the social cost of creating it (Friedman 1969)

-the central bank would be simply accommodating Basell III regulations

These two solutions are not groundbreaking: the Fed would be either going back to the way things were before 2007 (uncollateralized Fed daily overdrafts), or taking into account new developments (the emergence of IOER).

Subscribe

  • Entries (RSS)
  • Comments (RSS)

Archives

  • January 2023
  • December 2022
  • November 2022
  • August 2022
  • February 2022
  • April 2021
  • November 2020
  • October 2020
  • September 2020
  • August 2020
  • July 2020
  • June 2020
  • May 2020
  • April 2020
  • March 2020
  • February 2020
  • January 2020
  • December 2019
  • November 2019
  • October 2019
  • May 2019
  • March 2019
  • February 2019
  • January 2019
  • December 2018
  • November 2018
  • October 2018
  • September 2018
  • August 2018
  • June 2018
  • May 2018
  • March 2018
  • February 2018
  • January 2018
  • November 2017
  • October 2017
  • September 2017
  • August 2017
  • July 2017
  • June 2017

Categories

  • AI
  • Asset Allocation
  • blockchain
  • China
  • De-urbanization
  • Debt
  • Decentralization
  • EM
  • Energy
  • Equity
  • FX
  • g88kboy
  • Monetary Policy
  • Politics
  • Questions
  • Quotes
  • The last man standing will laugh
  • Travel
  • UBI
  • Uncategorized
  • VR

Meta

  • Register
  • Log in

Blog at WordPress.com.

  • Follow Following
    • BeyondOverton
    • Join 73 other followers
    • Already have a WordPress.com account? Log in now.
    • BeyondOverton
    • Customize
    • Follow Following
    • Sign up
    • Log in
    • Report this content
    • View site in Reader
    • Manage subscriptions
    • Collapse this bar
 

Loading Comments...