Liquidity is getting tighter. The decline in Fed repos is simply a reflection of their increased cost. Therefore, we will know when things are really getting bad if repo volumes start to pick up. Finally, if the market expected to get a flush of liquidity towards month end from TGA, this is now less likely to happen.
First drop in overall Fed’s balance sheet since 02/26. And it is a rather large drop, $74Bn.
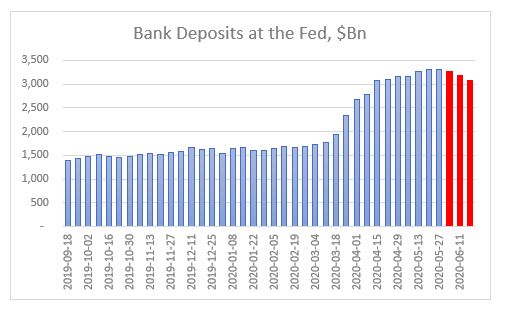
Third week in a row of declines in bank deposits. Level now is the same as 04/15. The 4-week rolling growth rate is now the lowest since the Fed’s U-turn last September.
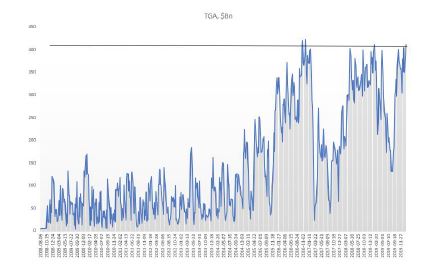
TGA continues to climb to record highs despite some disbursements towards Fed’s SPVs as new programs get triggered. It is likely that the level of TGA depends on the amount of SBA loans drawn/forgiven and such TGA can stay above $800Bn, Treasury’s target, for some time.
CB swap lines decline by $92Bn – first large decline as some of them have matured and no additional USD funding required.
Net repos outstanding continue to decline – this has been a feature all of this week as both O/N and term repos have been 0 for USTs. Reason for that is Fed raised the minimum bid on O/N to IOER +5bps and on term to IOER +10bps. This was a surprise, not that it happened (Fed probably made that decision at its April FOMC already), but that it happened ahead of tax receipts day. Commercial banks now must step in to fill in the gap but with their deposits on decline, their flexibility is diminished.
Fed bought $83Bn of mortgages – that’s perhaps to compensate for net selling in the previous 3 weeks.
Extra liquidity is getting withdrawn. That’s it. Market is not in distress yet. For that, we will know it when Fed repo volumes start picking up again and O/N rates shoot up. But for sure, on the margin, there is less liquidity to go around. Markets are not reflecting this yet. Perhaps, waiting for a sign, that all this surplus liquidity has been withdrawn, to react.
“I am here for one reason and one reason alone. I’m here to guess what the music might do a week, a month, a year from now. That’s it. Nothing more. And standing here tonight, I’m afraid that I don’t hear a thing. Just…silence”
~Margin Call
At the moment, the popular narrative in the market is that the Fed has created the greatest liquidity boost ever. On the back of it, US stock prices, in particular, have risen in an almost vertical fashion since September 2019. The irony is that this boost of liquidity was not big enough to justify such a reaction. In fact, if we compare Fed’s recent balance sheet increase to QE 1,2,3, it becomes obvious that they have little in common, which is why central bank officials have continuously stated that this is not QE. Whether that is the case or not is not a question of trivial semantics. It actually carries important market implications: once this overestimation of Fed liquidity becomes common knowledge, the stock market would have to correct accordingly.
The large increase of autonomous factors on the liability side of the Fed’s balance sheet is at the core of this misunderstanding.
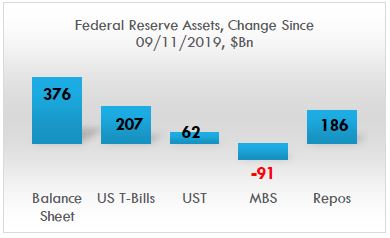
Although the Fed has indeed been doing around $100Bn worth of repo operations on a daily basis since September 2019 (less so recently), these operations are only temporary (overnight and 14-days), i.e. they cannot be taken cumulatively in ascertaining the effect on liquidity. In fact, during that period, the Fed’s balance sheet increased by only about $400bn, of which about half came from repos, the other from securities purchases, mostly T-Bills, with the increase in UST (coupons) more than offset by the decline in MBS.
Source: FRB H.4.1, BeyondOverton
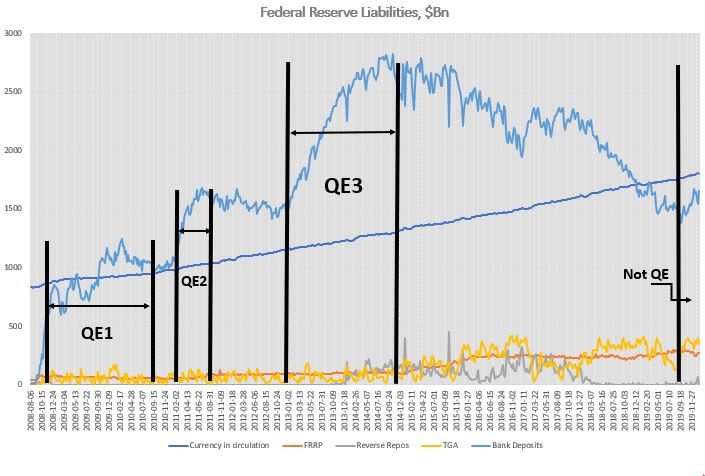
However, not all of the increase in Fed’s balance sheet went towards interbank liquidity: bank reserves rose by only about $150Bn (as of 22/01/2020), less than half of the total! Almost two-thirds went towards an increase in the Treasury General Account (TGA), which takes liquidity out. The growth of currency in circulation (which also decreases liquidity) was exactly offset by a net decline in reverse repos: a drop in the Foreign Reverse Repos (FRP), but a rise in domestic reverse repo.
Source: FRB H.4.1, BeyondOverton
Fed actually started increasing its T-Bills and coupons portfolio already in mid-August, three weeks before the repo spike. Part of that increase went towards MBS maturities. But by the end of August, Fed’s balance sheet had already started growing. By the third week of September, also the combined assets portfolio (T-Bills, coupons, MBS) bottomed out, even though MBS continued to decrease on a net basis.
Source: FRB H.4.1, BeyondOverton
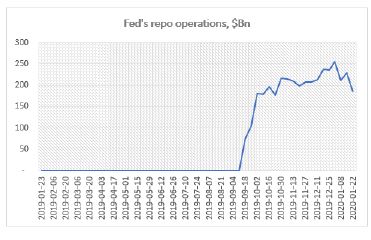
Fed’s repo operations began the second week of September. They reached a high of $256Bn during the last week of December. At $186Bn, down $70Bn from the highs, they are at the same level where they were in mid-October.
Source: FRB H.4.1, BeyondOverton
On the liability side, TGA actually bottomed out two weeks before the Fed started buying coupons and T-Bills, while the FRP topped the week the Fed started the repo operations. Could it be a coincidence? I don’t think so. My guess is that the Fed knew exactly what was going on and took precautions on time. Just as we found out that the Fed had lowered the rate paid on FRP to that of the domestic repo rate, we might also one day find out if it did indeed nudge foreigners to start moving funds away.
Source: FRB H.4.1, BeyondOverton
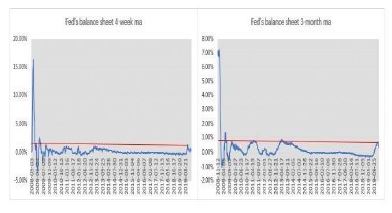
So, while the Fed’s liquidity injection since last September was substantial relative to the period when the Fed was tapering (2018) or when the balance sheet was not growing (2015-17), it is a stretch to make a claim that this is the greatest liquidity boost ever. The charts below show the 4-week and 3-month moving average percentage change in the Fed’s balance sheet. The 4-week change in September was indeed the largest boost in liquidity since the immediate aftermath of the 2008 financial crisis. The 3-month change, though, isn’t.
Source: FRB H.4.1, BeyondOverton
The Fed pumped more liquidity in the system during the European debt crisis. In the first four months of 2013, both the growth rate of the Fed’s balance sheet and the absolute increase of assets and bank reserves were higher than in the last four months of 2019. Moreover, there were no equivalent increases in either the TGA or the FRP.
Source FRB H.4.1, BeyondOverton
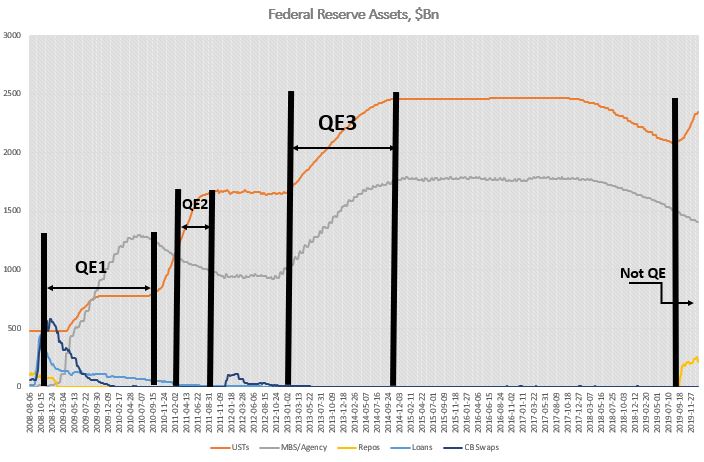
In fact, the reason Fed’s balance sheet changes this time around did not provide any substantial boost to liquidity, is precisely because they are very different from the three QE episodes immediately after the 2008 financial crisis.
For example, during QE1, the increase in securities held was more than three times the increase in Fed’s total assets. That was mostly because loans and central banks (CBs) swaps declined, to make up the difference. The Fed bought both coupons and MBS. However, 75% of the increase in assets came from a rise in MBS (from $0 to almost $1.2Tn), while T-Bills remained unchanged and agencies declined.
The Fed had begun to extend loans to primary dealers (PDs) even before September 2008, but immediately after Lehman Brothers failed, it included asset-backed/commercial paper/money market/mutual fund entities to this list of loan recipients as well. At around $400Bn, these were short-term loans, designed to pretty much make sure that no other PD or any significantly important player failed.
By the time QE1 finished most of these loans were repaid. In a similar fashion, the Fed had already put in place CBs swap lines even before September 2008, but they got really filled up, to the tune of more than $500Bn, after the Lehman Brothers event. Finally, repos actually decreased during QE1. Bottom line is, as far as Fed’s assets are concerned, September 2019 had no resemblances at all to September 2008.
On the liability side, the differences were also stark. Unlike 2019, during QE1 bank reserves contributed to 95% of the overall increase of balance sheet. The FRP remained pretty much flat for the full duration of QE1, while the TGA was unchanged but it did exhibit the usual volatility during seasonal funding periods.
Source: FRB H.4.1, BeyondOverton
QE2 was much more straightforward than QE1. Fed’s assets increased only on the back of coupon purchases (around $600Bn), while the Fed continued to decrease its MBS and loans portfolio. On the liability side, bank reserves continued to contribute about 95% of the increase. The rest was currency in circulation. Bottom line here again is that there is really no resemblance to 2019.
QE3 was similar to QE2 in the sense that Fed’s reserves increased 100% on the back of securities purchases (around $1.6Tn), but this time split equally between coupons and MBS. On the liability side, however, at 80% of total, bank reserves contributed slightly less towards the overall increase than during QE1 or QE2. The rest was split between currency in circulation and reverse repos. So, during QE3 less of the Fed’s balance sheet increase, than during the previous QEs, contributed to liquidity overall, but still much more than in 2019.
Reverse repos were especially prominent after QE3, when the Fed stopped growing its balance sheet but before it actually started tapering it. Probably, that was the sign that the banking system was actually running enough surplus reserves that it was willing to give some of the liquidity back to the Fed.
To recap, whatever the Fed has been doing so far, starting in September 2019, has simply no comparisons with any of the previous QEs. The largest increases on the Fed’s balance sheet in 2019 were T-Bills and repos; the Fed never bought T-Bills or engaged in repos in any of the previous QEs – the asset mix was totally different. On the liability side, while in the QEs almost all of the increase went directly into bank liquidity, in 2019 less than 50% did. FRP was more or less unchanged, at around $100Bn, between the beginning of QE1 and the end of QE3, but by September 2019 it had tripled. TGA averaged around $60Bn before the end of QE3; thereafter the average increased four times!
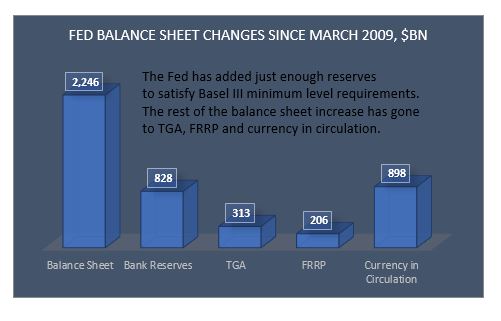
As a matter of fact, when we put the whole picture together, the case could be made that the Fed did not really create any additional liquidity at all since equities bottomed in March 2009.
Fed’s assets have increased by about $2Tn since then. But only 37% of that increase went to bank reserves. 40% went towards the natural increase of currency in circulation, 14% went to the TGA and 9% went to the FRP (last three drawing liquidity out).
Source: FRB H.4.1, BeyondOverton
Yes, bank reserves have increased by about $800Bn since then but also have bank reserves needs on the back of Basel III liquidity requirements. According to the Fed itself, the aggregate lowest comfortable level of reserve balances in the banking system ranges from $600Bn to just under $900Bn. Thus, at $1.6Tn currently, there is not much excess liquidity left in the system: on a net basis, whatever extra liquidity was created, it happened between September 2008 and March 2009.
More precisely, actually, the Fed did create surplus liquidity up to about the end of 2014. Between 2015 and the end of 2017, the liquidity in the system stayed flat. After that, the Fed started taking liquidity out, and by the middle of 2019 it left just about enough surplus liquidity (over and above the March 2009 level) to satisfy Basel III liquidity requirements.
Going forward, it is very likely that the bulk of the increase of the central bank’s balance sheet is behind us for the moment, ceteris paribus. The Fed will continue shifting from repos to T-Bills and probably coupons (especially if it hikes the IOER/repo rate, as expected). The effect on liquidity will depend on the mixture of liabilities, though. I expect the TGA to start drifting lower with seasonality as well as because it is at level associated with reversals in the past.
Source: FRB H.4.1, BeyondOverton
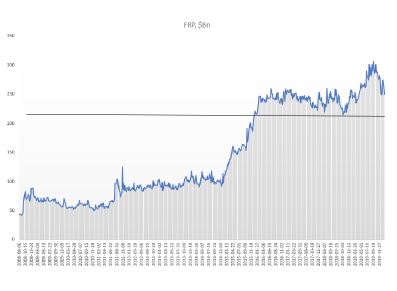
FRP has a bit more to go on the downside but I think it will struggle to break $200Bn, and it might settle around $215Bn. TGA and FRP declining should help liquidity even if Fed’s balance sheet does not increase. If the decline in the demand for repos is less than Fed’s securities purchases, bank reserves are likely to go up: this should help liquidity overall. Otherwise, it depends on the net effect of the change in all autonomous factors.
Source: FRB H.4.1, BeyondOverton
So, while the Fed has just about created enough liquidity to take bank reserves to the level of March 2009 (plus the reserves required to meet Basel III liquidity requirements), S&P 500 is up 10% since the Fed started this latest liquidity injections, and almost 400% since the bottom in 2009: an outstanding performance given all of the above. While the rise in the market pre 2019 can be fully attributed to massive corporate share buybacks, with active managers and real money (households, pension funds, mutual funds and insurance companies) net sellers of equities, thereafter, it is more of a mixed bag.
In 2019 retail money picked up the baton from corporates and bought the most equities since the 2008 financial crisis[1]. In addition, there has been relentless selling of volatility in the form of exotic structured retail products (mostly out of Asia[2]), betting on a continued stability and a rising trend on the back of the ongoing US corporate share buyback program, combined with the Fed’s about face on rates last year. Together with an all-time record speculative selling of VIX futures, this has left the street, generally speaking, quite long gamma, thus further helping the market’s bullish stance (to monetize their gamma exposure, dealers sell on rallies and buy on dips, thus cushioning the market on the way down, while the buying from other sources ensures the market keeps grinding higher).
Having mostly missed the extraordinary rally in US stocks during 2009-2018 (i.e. during the Fed’s previous balance sheet expansions and before the tapering), real money did not want to be left out on this one as well. However, not only the premises for this bullishness are unfounded, as discussed above, but also the internals of the previous stock market rally might be changing.
Corporate share buybacks, while still strong, are fading. This is happening for two main reasons. First, the Boeing scandal (prior to last year, Boeing was one of the largest share buyback companies in the US), I believe, is really accelerating bipartisan support to allow regulators more leeway into scrutinizing how companies choose to spend their cash. Second, with corporate earnings growth slowing down, US companies have been substantially scaling down their plans for share buybacks in 2020, anyway.
Neither the fact that the central bank liquidity is much smaller than envisioned, nor that the breadth of the rally is narrowing, seems to be on people’s radar at the moment. On the contrary, investors might be even embracing a completely new paradigm, this-time-is-different attitude, which sometimes comes at moments preceding a market correction. For example, at Davos 2020, Bob Prince, the Co-CIO of the largest hedge fund in the world, Bridgewater, said in an interview with Bloomberg TV, that he believed the boom-bust cycle was over. In fact, he went further in elaborating on this view:
“Stability could be an opportunity…You’ll hear the tremors before the earthquake. It won’t just come upon you all of a sudden. Volatility is out there, but it is not imminent.” This reminded me of the build-up to the 2008 financial crisis[3]. It’s not that people did not see the risks in subprime mortgage CDOs back then. They did, and that was why it took them some time to get in on the
[1] See Brace Your Horses, This Carriage is Broken”, BeyondOverton, January 14, 2020
[2] “How an exotic investment product sold in Korea could create havoc in the US options market”, Bloomberg, January 20, 2020
[3] “When the music stops, in terms of liquidity, things will be complicated. But as long as the music is playing, you’ve got to get up and dance.”, Chuck Prince, CEO of Citibank, the largest US bank in 2007.
I am late in this debate, at least in writing, because at first, I thought it did not matter; it is all semantics. Last week I read John Authers’ article in Bloomberg in which he referenced a chart from CrossBorder Capital that showed that the Fed had recently injected the greatest liquidity boost ever. That got me really curious, so I did some digging in the Fed’s balance sheet and I concluded, notwithstanding that I am not privy of how CrossBorder Capital defines and measures liquidity, it is unlikely that the Fed’s actions led to the ‘greatest liquidity boost ever’. And then yesterday Dallas Fed President Kaplan said he was worried about the Fed creating asset bubbles. This pushed the ‘old’ narrative that CBs’ liquidity/NIRP/ZIRP is creating a mad search for yield and a rush in risky assets out of the woodwork again on social media. So, that got me thinking that whatever the Fed did since last September, whether it is QE or not, actually matters.
So, just to refresh, since September 2019, the Fed’s balance sheet increased by about $400bn, of which more than half came from repos, the other from mostly T-Bills, with the increase in coupons more than offset by the decline in MBS. On the liability side, there was a similar breakdown: about 50% came from an increase in bank deposits, the other 50% came from an increase in currency in circulation and the TGA account. This 50/50 in both assets and liabilities is important to keep in mind.
Source FRB H.4.1, BeyondOverton
During QE1, the increase in securities held was more than 3x the increase in Fed’s total assets. That was mostly because loans and CBs swaps declined to make up the difference. On the securities side, the Fed bought both coupons and MBS. T-Bills remained the same, while agencies declined. However, 75% of the increase in assets came from a rise in MBS (from $0 to almost $1.2Bn). The Fed had begun to extend loans to some market players even before September 2008, but immediately after Lehman Brothers failed, the Fed extended loans to primary dealers (PD) as well as asset-backed/commercial paper/money market/mutual fund entities to the tune of about $400Bn. These were very temporary loans, pretty much making sure that no other PD or any other significantly important player failed. By the time QE1 finished the loans had gone back to almost pre-Lehman-time sizes. In a similar fashion, the Fed had already put in place CBs swaps even before September 2008, but immediately thereafter, the CB swap line jumped to more than $500Bn, and by the time QE1 finished it had gone to $0. Finally, repos actually decreased during QE1. Bottom line is, as far as Fed’s assets are concerned, September 2019 had absolutely no resemblances at all to September 2008.
Source: FRB H.4.1, BeyondOverton
On the liability side, the differences were also stark. Unlike 2019, during QE1 bank reserves contributed to 95% of the increase. The FRRP account remained pretty much flat for the full duration of QE1, while the TGA account was unchanged but it did exhibit the usual volatility during seasonal funding periods.
QE2 was much more straightforward than QE1. The Fed’s assets increased only on the back of coupon purchases (around $600Bn), while the Fed continued to decrease its MBS and loans portfolio. On the liability side, bank reserves continued to contribute about 95% of the increase. The rest was currency in circulation. Bottom line here again, really no resemblance to 2019.
QE3 was similar in the sense that Fed’s reserves increased 100% on the back of securities purchases (around $1.6Tn), but this time split equally between coupons and MBS. On the liability side, at 80% of total, bank reserves contributed slightly less towards the overall increase. The rest was split between currency in circulation and reverse repos. During QE3, unlike QE1 and QE2, less of the Fed’s balance sheet increase went towards higher liquidity (bank reserves), but still nothing like in 2019. For one reason or another, the market was willing to give some of the liquidity back to the Fed in the form of reverse repos even before the Fed started tapering (reverse repos were prominent after QE3 when the Fed stopped growing its balance sheet but before it actually started tapering it).
No, you can’t call whatever the Fed has been doing so far, starting in September 2019, QE. There are simply no comparisons with any of the previous QEs: The largest increases on the Fed’s balance sheet in 2019 was T-Bills and repos; the Fed never bought T-Bills or engaged in repos in any of the previous QEs – the asset mix was totally different. On the liability side, while in the QEs almost all of the increase went directly into bank liquidity, in 2019 only 50% did. FRRP was more or less unchanged, at around $100Bn between QE1 start and the end of QE3 – by September 2019 it had tripled! TGA averaged around $60Bn before the end of QE3; thereafter the average increased 4x!
As to the second issue of how much of the Fed’s liquidity injection since the crisis has boost asset prices? Not much.
According to the Fed’s own flow of funds data, real money has been a net seller of equities and buyer of risk-free assets since the 2008 financial crisis. If there is a rush into risky assets, it is not obvious from the data. There is also this argument that the Fed’s consistent boost of liquidity, combined with low interest rates, provides the proverbial put for prices and, therefore, the search for yield can be implemented by selling vol/gamma. This could indeed be the case. The problem is that I have not seen any data which shows exactly what the $ notional (in cash equities) equivalent of that vol selling flow is.
Moreover, given that both ECB and BOJ have engaged in even bigger balance sheet expansions, plus their interest rates are negative, the case could be made for a similar exercise in Europe and Japan. However, both European and Japanese equity markets have been languishing for years, underperforming US equity markets. Finally, even if this indeed were the case, the more likely explanation for the reasons people would be selling vol is the relentless bid from corporates engaging in share buybacks. This would also explain the underperformance of equity markets abroad relative to US ones despite higher CBs’ liquidity boosts there.
But how much liquidity did the Fed provide since the 2008 financial crisis?
Source: FRB H.4.1, BeyondOverton
Equities bottomed in March 2009. Fed’s assets increased by about $2Tn thereafter. But only 37% of that increase went to bank reserves. 40% went towards the natural increase of currency in circulation, 14% went to TGA and 9% went to the FRRP (drawing liquidity out). It is slightly better if one does the comparison since QE1, but even there, at most, 50% went directly to bank reserves.
Finally, one has to take into account that banks’ reserves needs have also substantially increased since the 2008 financial crisis on the back of Basel III requirements. According to the Fed itself, the aggregate lowest comfortable level of reserve balances in the banking system ranges from $600Bn to just under $900Bn. At $1.6Tn currently, there is not much excess liquidity left in the system. In fact, banks Fed deposits were already at around $800bn in March 2009. Given that most of the regulations were implemented thereafter, one could claim that no additional liquidity was really added to the banking system since.