At $3.2Tn, US Treasury (UST) net issuance YTD (end of June) is running at more than 3x the whole of 2019 and is more than 2x the largest annual UST issuance ever (2010). At $1.4Tn, US corporate bond issuance YTD is double the equivalent last year, and at this pace would easily surpass the largest annual issuance in 2017. According to Renaissance Capital, US IPO proceeds YTD are running at about 25% below last year’s equivalent. But taking into consideration share buybacks, which despite a decent Q1, are expected to fall by 90% going forward, according to Bank of America, net IPOs are still going to be negative this year but much less than in previous years.
Net issuance of financial assets this year is thus likely to reach record levels but so is net liquidity creation by the Fed. The two go together, hand by hand, it is almost as if, one is not possible without the other. In addition, the above trend of positive Fixed Income (FI) issuance (both rates and credit) and negative equity issuance has been a feature since the early 1980s.
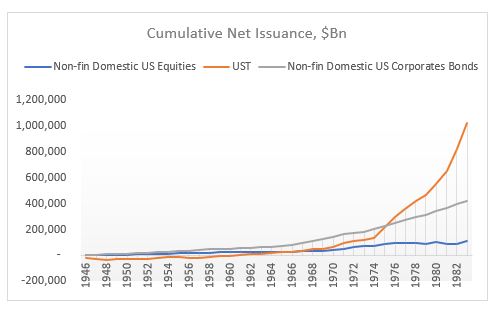
For example, cumulative US equity issuance since 1946 is a ($0.5)Tn. Compare this to total liquidity added as well as issuance in USTs and corporate bonds.*
The equity issuance above includes also financial and foreign ADRs. If you strip these two out, the cumulative non-financial US equity issuance is a staggering ($7.4)Tn!
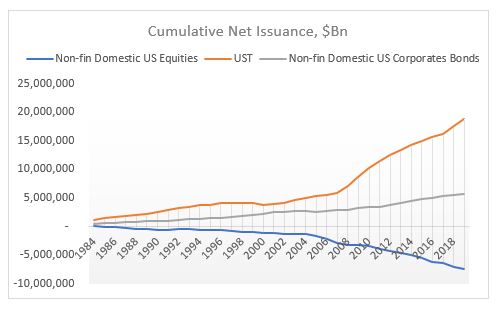
And all of this happened after 1982. Can you guess why? SEC Rule 10b-18 providing ‘safe harbor’ for share buybacks. No net buybacks before that rule, lots of buybacks after-> share count massively down. Cumulative non-financial US equity issuance peaked in 1983 and collapsed after. Here is chart for 1946-1983.
Equity issuance still lower than debt issuance but nothing like what happened after SEC Rule10B-18, 1984-2019.
Buybacks have had an enormous effect on US equity prices on an index basis. It’s not as if all other factors (fundamentals et all) don’t matter, but when the supply of a financial asset massively decreases while the demand (overall liquidity – first chart) massively increases, the price of an asset will go up regardless of what anyone thinks ‘fundamentals’ might be. People will create a narrative to justify that price increase ex post. The only objective data is demand/supply balance.
*Liquidity is measured as Shadow Banking + Traditional Banking Deposits. Issuance does not include other debt instruments (loans, mortgages) + miscellaneous financial assets. Source: Z1 Flow of Funds
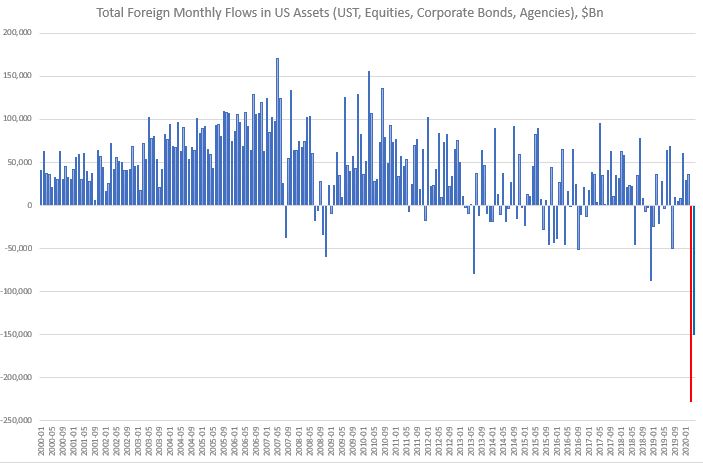
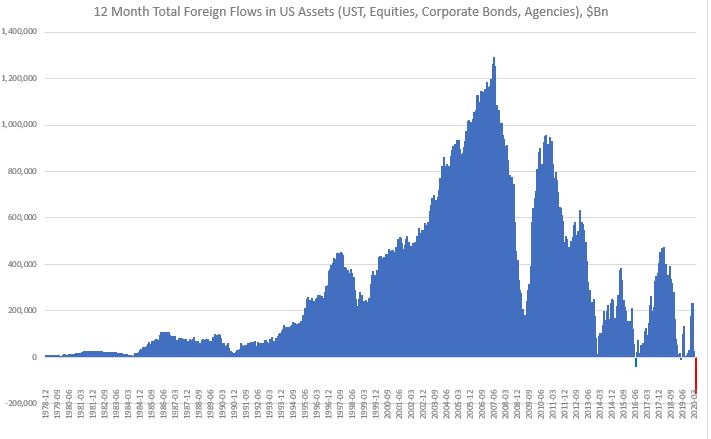
Foreign selling starts to pick up also in US equities and agencies.
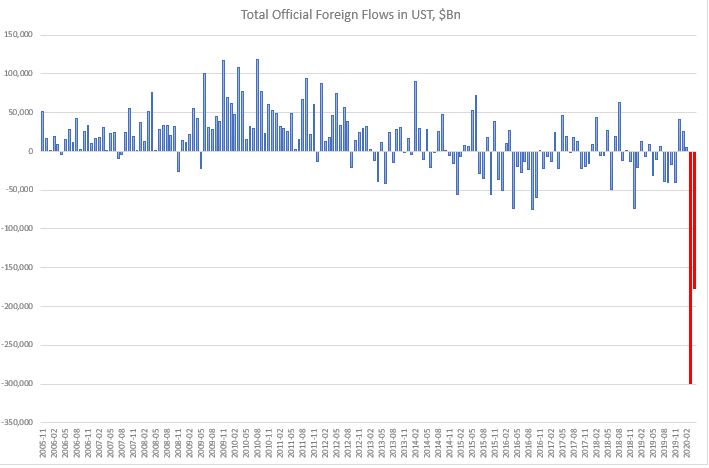
March broke the record for Total foreign monthly outflow.
This happened largely on the back of a record Private foreign sector outflow.
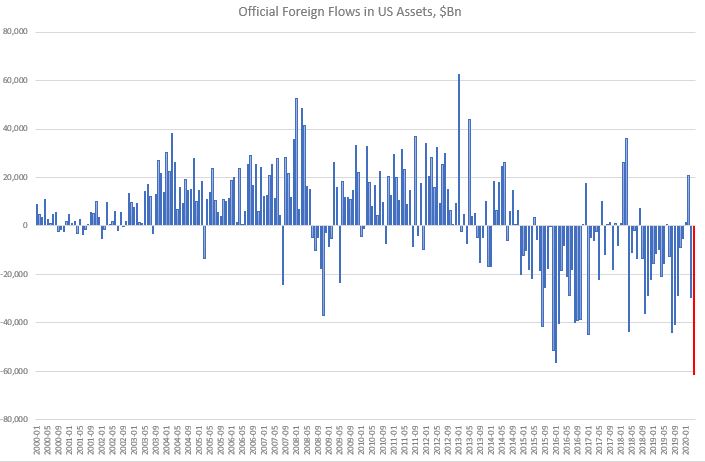
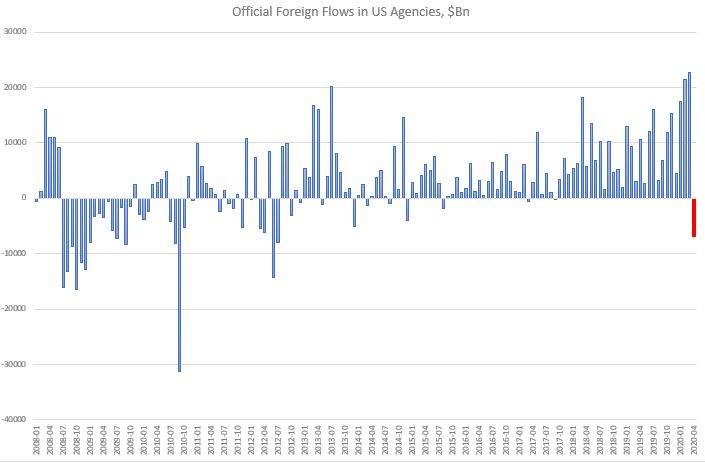
April still saw a large net foreign outflow, though not as big as March. Nevertheless, this time, the Official foreign flow reached an all-time low.
This is significant because the 12-month rolling cumulative total foreign flow in US turned negative by a large amount. This is very, very unusual.
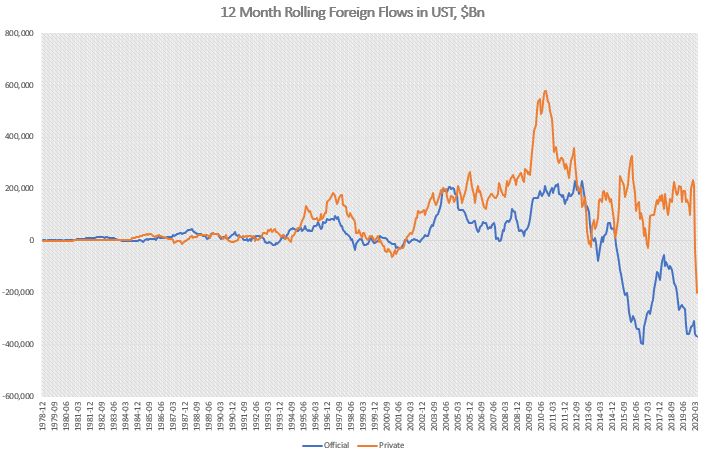
Foreigners are still focused at the moment on selling primarily USTs.
While in the past, private foreign accounts may have bought USTs even when official foreign accounts were selling, in the last two months (April-March), private foreign money turned sellers in size. In fact, their outflows have been several times bigger than the official foreign account outflows. This most recent selling put the 12-month rolling UST private foreign flow in negative territory in March. It reached an all-time low in April. The 12-month rolling UST official foreign money flow is also close to its all-time record low, reached in November 2016.
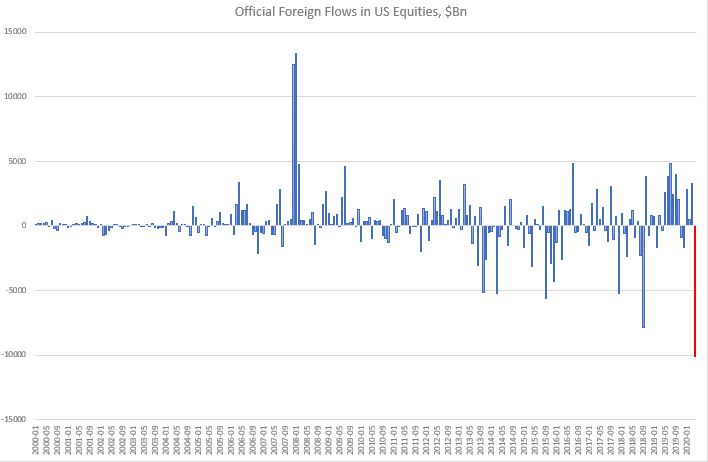
On the US equities side, unlike in March, though, this time foreigners were net sellers. The total outflow was not that large by historical standards, but the official foreign outflow was.
Foreigners continued to buy US corporate bonds, especially official foreign money. Nothing new there.
Finally, on the agencies side, official foreign accounts were a rather unusual and large seller.
Conclusion: The continuous high level of total foreign US assets outflows in April is interesting and could herald a change in trend of previous USD inflows. We can see that by looking at the rolling 12-month data which turned negative in March and is accelerating lower. In theory, there shouldn’t have been any forced pressure on foreign accounts to exit US assets in April, as Fed/Other Central Banks swap and repo lines were already in place. If this continues, the USD may be in bigger trouble than initially thought. See here, here and here.
There have been two dominant trends in the last four decades. The breakdown of the Bretton Woods Agreement in the early 1970s, the teachings of Milton Friedman, and the policies of Ronald Reagan, eventually ushered in the process of US financialization in the early 1980s. The burst of the Japan bubble in 1990, the Asian and EM financial crises of the mid-1990s, the dotcom bubble, and, finally, China’s entry into WTO in the early 2000s, brought in the era of globalization. This whole period has greatly benefited US, US financial assets and the US Dollar.
An unwind of these two trends of financialization and globalization is likely to have the opposite effect: causing US assets and the US dollar to underperform. From a pure flow perspective, going forward, foreigners are likely to invest less in the US, or may even start selling US assets outright. They are such a large player that their actions are bound to have a big effect on prices.
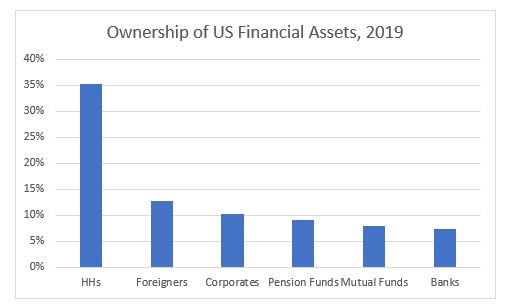
Foreigners have played an increasingly bigger role in US financial markets. In terms of ownership of US financial assets, if they were an ‘entity’ on its own, they would be the second largest holder of US financial assets in the US, after US households.
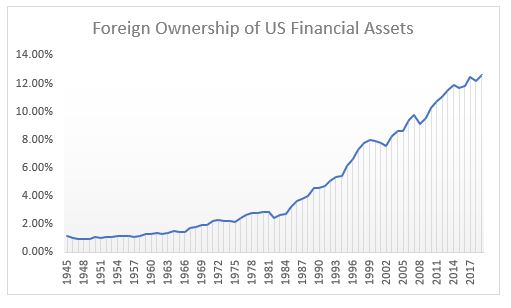
Foreigners owned about 2% of all US financial assets between 1945 and the 1980s. That number doubled between 1980 and 1990 and then tripled between 1990 and 2019!
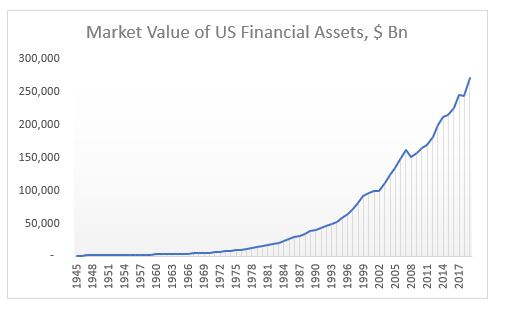
As of the end of 2019, there were a total of $271Tn US financial assets by market value. Non-financial entities owned the majority, $129Tn, followed by the financial sector, $108Tn, and foreigners $34Tn.
The financial crisis of 2008 ushered in a period of financial banking regulation (on the back of the US authorities’ bail-out), which has slowly started to dismantle some of the structures built in the previous period starting in the 1980s. The Covid-19 pandemic and the resulting government bailout of the whole US financial industry, this time, are likely to intensify this regulation and spread it more broadly across all financial entities. As a result of that, there have been already calls to rethink the concept of shareholders primacy which had been a bedrock of US capitalism since the 1980s.
In addition, the withdrawal of the UK from the EU in 2016, followed shortly by the start of a withdrawal of the US from global affairs with the election of Donald Trump, ushered in the beginning of the process of de-globalization. The US-China trade war gave a green light for many companies to start shifting global supply chains away from China. The Covid-19 pandemic intensified this process, but instead of seeking a new and more appropriate location, companies are now reconsidering whether it might make sense to onshore everything.
What we are seeing is the winding down of these two dominant trends of the last 40 years: financialization and globalization. The effects globally will be profound, but I believe US financial assets are the most at risk given that they benefited the most in the previous status quo.
De-financialization is likely to reduce shareholder pay-outs (both buybacks and dividends) which have been at the core of US equities returns over the years. The authorities are also likely to start looking into corporate tax havens as a source of government cash drain in light of ever-increasing deficits. As a result, and as I have written before, I expect US equities to have negative returns (as of end of 2019*) for the next 5 years at least.
De-globalization is likely to reduce the flow of US dollars globally. Foreigners will have fewer USD outright to invest in US assets. Those, which are in need to repay USD debt, may have to sell US assets to generate the USDs. Indeed, the USD may strengthen at first but as US assets start to under-perform, the selling by foreigners will gather speed causing both asset prices as well as the USD to weaken further.
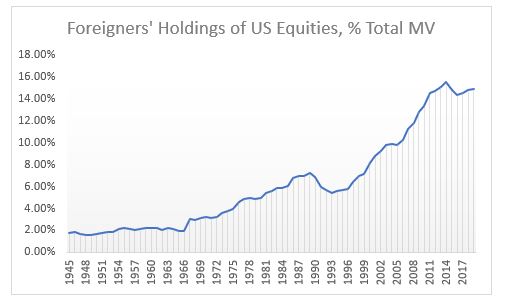
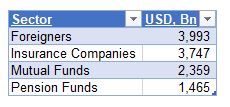
For example, foreigners are the third largest player in US equities, owning more than $8Tn as of the end of 2019. See below table for some of the largest holders.
As a percentage of market value, foreigners’ holdings peaked in 2014, but they are still almost double the level of the early 1990s and more than triple the level of the early 1980s. Last year, foreigners sold the most equities ever. Incidentally, HHs which have been a consistent seller of equities in the past, but especially since 2008, bought the most ever. Pension Funds and Mutual Funds, though, continued selling.
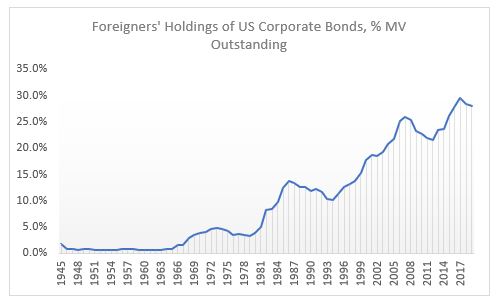
Foreigners are the largest holder of US corporate bonds, owning almost $4Tn as of end of 2019, more than ¼ of the market.
As a percentage of market value, foreigners’ holdings peaked in 2017, but they are still more than double the level of the early 1990s and 8x the level of the early 1980s.
Foreigners are also the largest holders of USTs, owning almost $6.7Tn as of end of 2019, more than 40% of the overall market.
As a percentage of market value, foreigners’ holdings peaked in 2008, at 57%! At today’s level, they are still about double the levels of the early 1990s and early 1980s.
There is a big risk in all these markets if the trends of the last four decades start reversing. US authorities are very much aware of the large influence foreigners have in US markets. The Fed’s swap and repo lines are not extended abroad just for ‘charity’, but primarily to ‘protect’ US markets from forced foreign selling in case they cannot roll their USD funding.
The UST Treasury market seems to be the most at risk here given the mountain of supply coming this and next year (multiple times larger than the previous record supply in 2008 – but foreigners back then were on a buying spree). The risk is not that there won’t be buyers, eventually, of USTs as US private sector is running a surplus plus the Fed is buying by the boatload, but that the primary auctions may not run as smoothly.
It was for this reason, I believe, that the authorities exempted USTs from the SLR for large US banks at the beginning of April. If that were not done, PDs might have been totally overwhelmed at primary auctions given the increased supply size, the fact that the Fed can’t bid and if foreigners start take up less. It is not clear, still, even with the relaxed regulation, how the primary auctions will go this year. We have to wait and see.
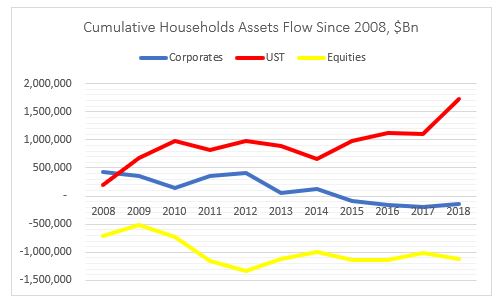
Households have massively deleveraged: sold about $1Tn of US equities and bought about $2Tn of USTs. The have also marginally divested from corporate bonds.
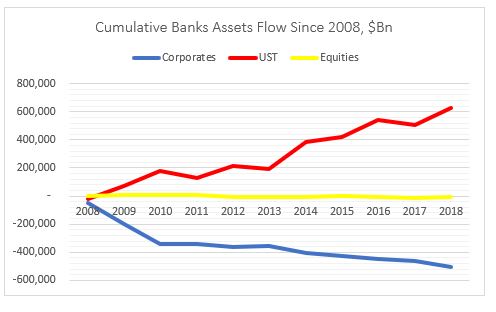
Banks have deleveraged as well: bought about $0.5Tn of UST while
selling about the same amount of equities. The have also marginally divested
from corporate bonds.
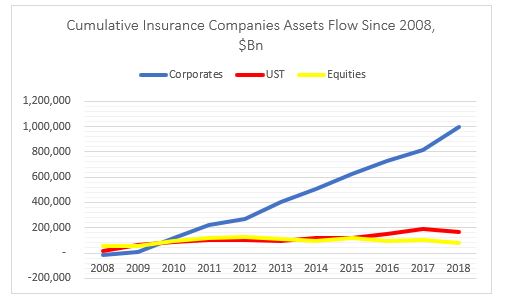
Insurance companies have put on risk: bought about $1Tn of
corporate bonds and small amounts of both equities and USTs.
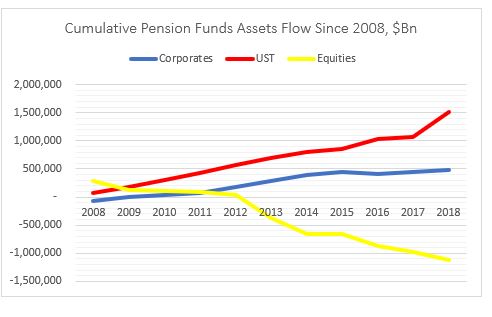
Mix bag for pension funds with a slight deleveraging: bought $0.5Tn
of corporate bonds but sold about $1Tn of equities. But also bought $1.5Tn of
USTs.
Mutual funds have put on risk: bought about $1Tn of corporate
bonds and small amount of equities. Also bought more than $1.5Tn USTs.
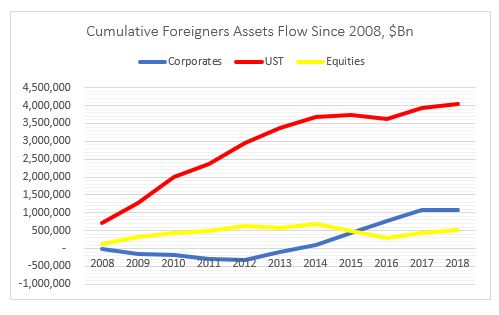
Finally, foreigners have also put on risk: bought $1Tn of
corporate bonds, $0.5Tn of equities and $4Tn of USTs.
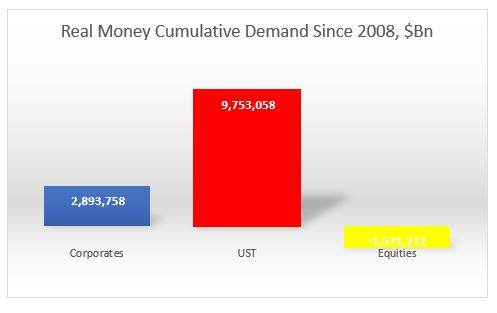
Overall, the most (disproportionate) flows went into USTs, followed by US
corporates. Demand for equities was actually negative from real money.
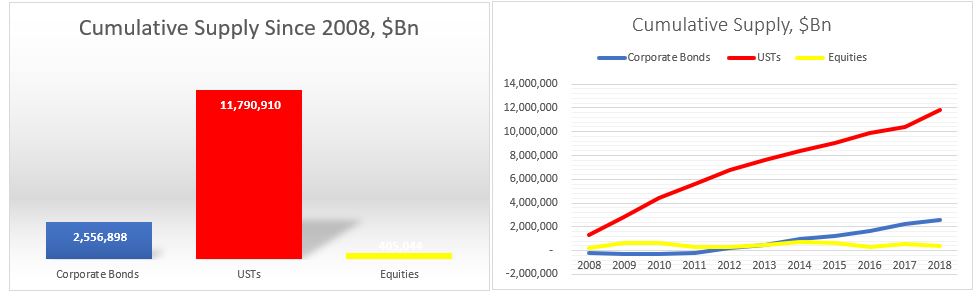
What about supply?
Issuance of USTs was naturally the dominant flow followed by US corporates and US equities.
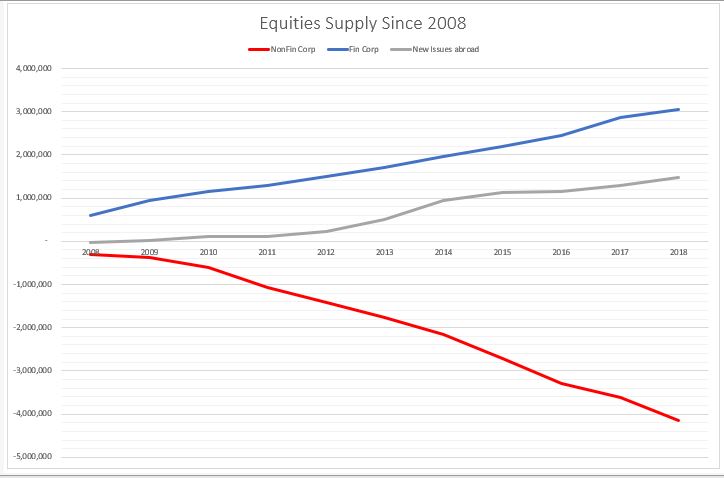
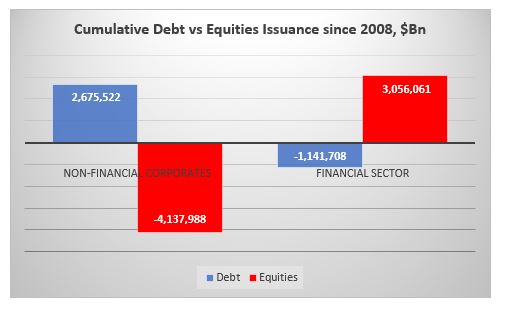
On the US equities side, however, there is a very clear distinction between US non-financial corporate issuance, which is net negative (i.e. corporates bought back shares) and US financial and US corporate issuance abroad, which is net positive. In other words, the non-corporate buybacks (more than $4Tn) were offset by the financial sector (ETF) and ‘ADRs’ issuance.
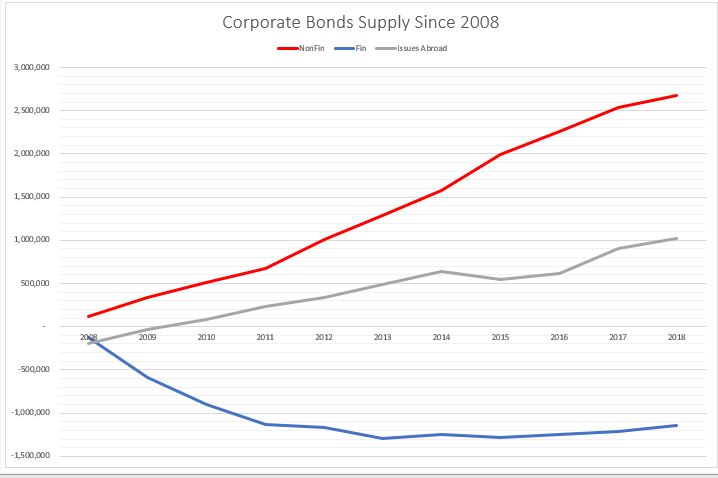
The opposite is happening on the corporate supply side. Non-financial corporates have done the majority of the issuance while the financial sector has deleveraged (reduced debt liabilities).
In other words, non-financial corporates have bought back their shares at the expense of issuing debt, while the financial sector (ETFs) has issued equities and reduced their overall indebtedness.
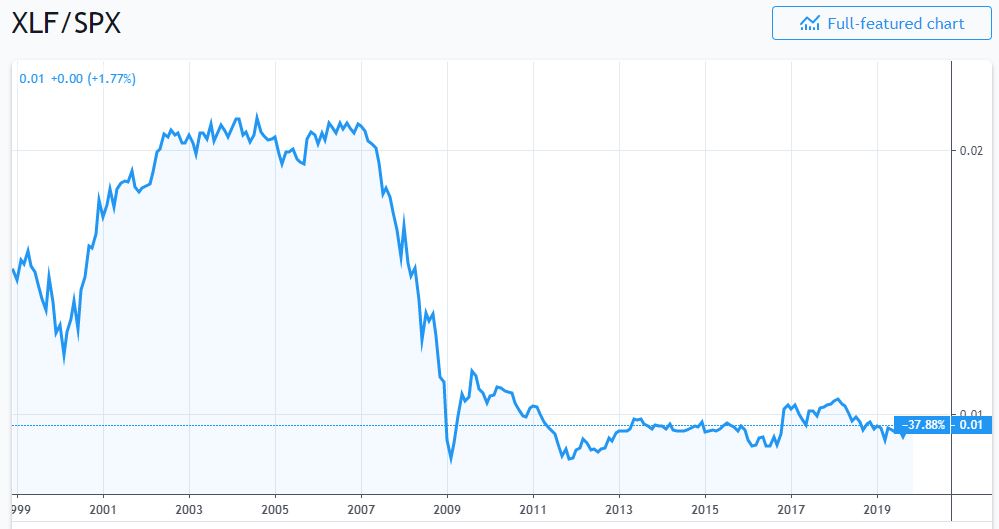
No wonder, then that financial sector shares have underperformed the overall
market since 2009.
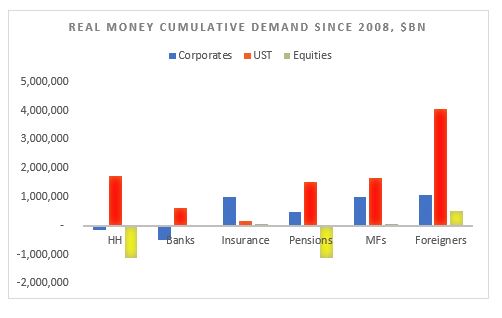
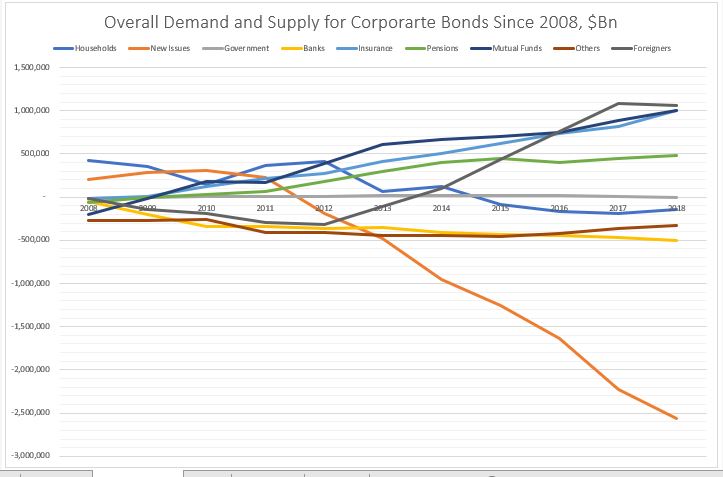
Putting the demand and supply side together this is how the charts look.
On the equities side, the buying comes mostly from ETFs (in ‘Others’ – that is basically a ‘wash’ from the issuance) and foreigners. The biggest sellers of equities are households and pension funds. The rest of the players, more or less cancel each other out.
So, households and pension funds, ‘sold’ to ETFs and foreigners.
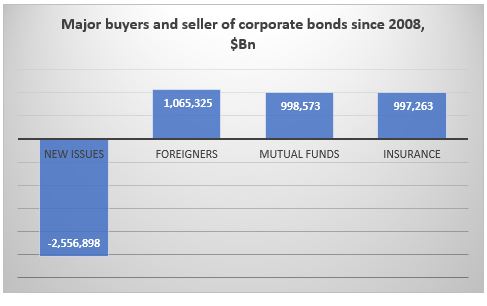
On the corporate bonds side, the main buyers were foreigners, mutual funds
and insurance companies. Pension funds also bought. The main seller were the
banks. ‘Others’ (close end funds etc.) and households also sold a small amount.
So, here it looks like foreigners, mutual funds and insurance companies ‘bought’
mostly at new issue or from the banks.
Finally, on the USTs side, everybody was a buyer. But the biggest
buyer by large were foreigners. Mutual funds, pension funds, the Fed and
households came, more or less, in equal amount, second. And then banks, ‘Others’
and insurance companies.
Kind of in a similar way, everyone here ‘bought’ at new issue.
Conclusion
It’s all about demand and supply.
In equities, real money has been a net seller in general, while the biggest buyer has been non-financial corporates themselves in the process of share buybacks. The financial sector has been a net issuer of equity thus its under-performance to the non-financial corporate sector. Equity real money flow is skewed mostly on the sell side.
Real money flow in corporate bonds is more balanced, but with a net
buying bias.
USTs real money flow is skewed completely on the buy side.
Overall, since 2008 real money has sold equities, bought a bit of corporate
bonds and bought a lot of UST: it does not seem at all that real money
embraced the bullish stance which has prevailed in the markets since March 2009.
*Data is from end of Q4’08 till Q4’18, Source for all data is Fed Z1 Flow of Funds