• About
  • BeyondOverton Travel
    • Silk Road (1): If Turkey is in crisis, it’s not obvious visiting it
    • Silk Road (2): Could beautiful nature and ancient history create a false sense of entitlement?
    • Silk Road (3): Fast Car
    • Silk Road (4):We took a bus ride to Iran
    • Silk Road (5): Border bothers
    • Silk Road (6): Chevrolet Land
    • Silk Road (7): Free-roaming camels and wild horses
    • Silk Road (8): China West to East
    • Silk Road (9): I have not told half of what I saw
  • BLOG
  • g88kboy Travel
    • On the Silk Road
    • Bulgaria : The Chicken crossed the Road
    • Turkey : The Country, not the Bird
    • Georgia on my Mind
    • Armenian Ayran
    • Iran – The Curious Land
    • An American in Azerbaijan
    • Uzbekistan: Golden Teeth and Neon Signs
    • Kazakhstan: Thirty Sweating Seniors
    • China Part One – Pandas Are Extinct
    • China Part Two: My TED Talk (Deep Analysis)
    • Phillipines – They Relax, I (pretend to😉) Study
    • Singapore: flashing trees and a torrent of tears
    • Malaysia: That ain’t no croc, it’s a log
    • Brunei: The Instinctive Fight for Superior Domination
    • Phillipines: Hello Friend Again
  • Outside the window
    • Bulgaria
    • Turkey
    • Georgia
    • Armenia
    • Iran
    • Azerbaijan
    • Uzbekistan
    • Kazakhstan

BeyondOverton

~ let's move this window

BeyondOverton

Category Archives: UBI

Inflation in the 21st century is a supply-side phenomenon

01 Saturday Aug 2020

Posted by beyondoverton in Monetary Policy, Politics, UBI

≈ 3 Comments

Tags

inflation

“For example, it is habitually assumed that whenever there is a greater amount of money in the country, or in existence, a rise of prices must necessarily follow. But this is by no means an inevitable consequence. In no commodity is it the quantity in existence, but the quantity offered for sale, that determines the value. Whatever may be the quantity of money in the country, only that part of it will affect prices, which goes into the market commodities, and is there actually exchanged against goods. Whatever increases the amount of this portion of the money in the country, tends to raise prices. But money hoarded does not act on prices. Money kept in reserve by individuals to meet contingencies which do not occur, does not act on prices. The money in the coffers of the Bank, or retained as a reserve by private bankers, does not act on prices until drawn out, nor even then unless drawn out to be expended in commodities.”

John Stuart Mill, Book III, Chapter VIII, Par.17, p.20

In his latest Global Strategy Weekly, Albert Edwards explains why he thinks the surge in the money supply is deflationary. As usual he is going against the consensus here even though he gives credit to people like Russell Napier who correctly identifies the changing nature of US money supply but concludes that this is highly inflationary. I think Albert is right for the wrong reasons, and Russell is wrong for the right reasons.

Albert Edwards is right when he says that ‘despite massive stimulus, deflation will nimble on for a while yet until capacity constraints become binding further down the road’ (emphasis mine). Yet in his view, deflation will persist because of keeping zombie companies alive by cheap credit. While, I have no doubt that this is invariably true, its effect on the deflation-inflation dynamics is weak because credit creation is now a much smaller part of the money supply than in the past.

Which is where Russell Napier comes in.  He is right in his view that ‘politicians have gained control of money supply’ but wrong to believe that this will inevitably cause a rapid rise in inflation unless, indeed, capacity does become binding.

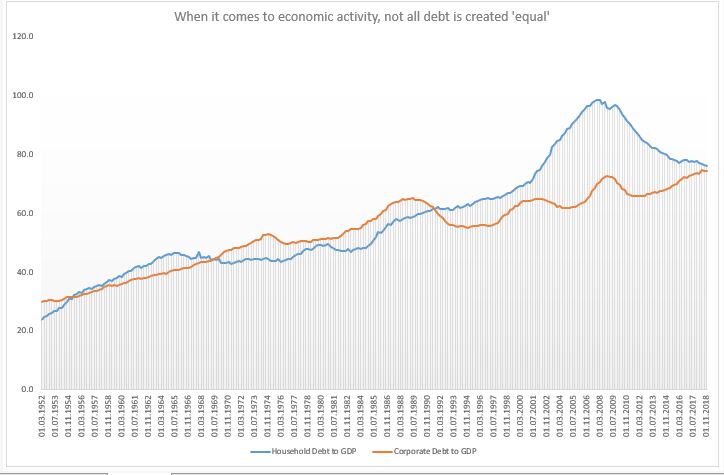
Reality is that money supply is now turned around on its head. While in the past, pre-2008, the delta of money supply consisted mostly of loans, after 2008 and during QE 1,2,3, it moved to loans plus QE-generated deposits. During the Covid crisis, it shifted further away from loans by adding even Government-generated deposits to the QE-time mix.

It is ironic that we had to go through QE, when the power of loan creation on money supply started to wane, for us to truly acknowledge their significance in the process of money creation in the first place. Loans create deposits – yes. But under QE, if Fed buys from a non-bank, the proceeds go in a deposit at a bank without the corresponding increase in loans. If it buys from a bank, reserves at the Fed go up.

Source: FRB H.8

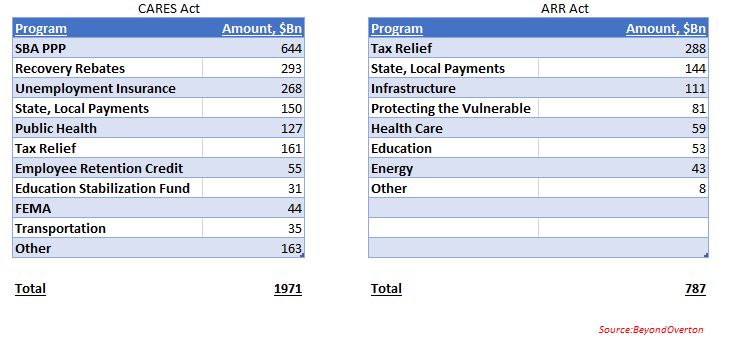
Things get more complicated when the government hands out free cash as it also goes on a deposit (Government-generated deposits) with no corresponding loan creation.

Source: FRED, FRB H.8

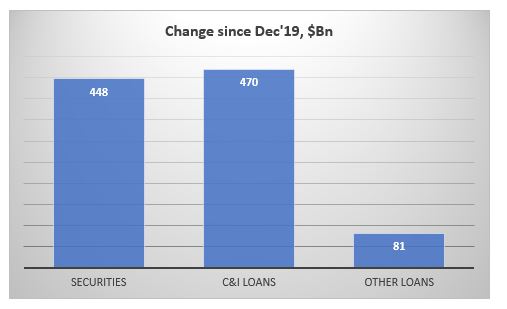
Of those bank credits, actually, only about half are loans, the other half are securities. So, in fact loans have created only about 1/6 of the money supply YTD (would be even less if measured after the Fed/Treasury initiated their programs in March).

Source: FRB H.8

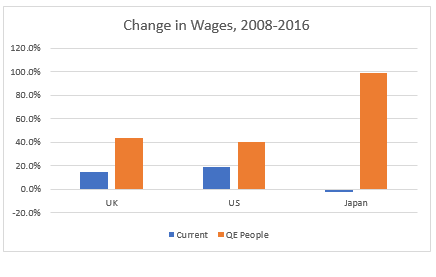
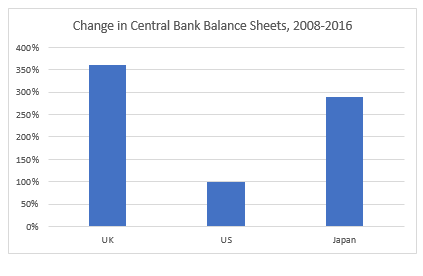
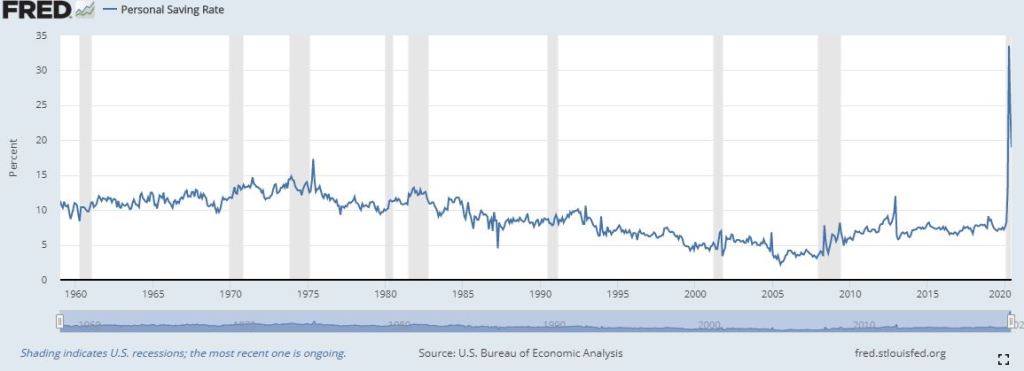
What about inflation? Difficult to see how this massive rise of money supply can produce any meaningful push in inflation given that the majority of that cash is simply being saved/invested in the market rather than consumed.

Moreover, this crisis is hitting the service sector much more than any other crisis in the past. And unlike the manufacturing sector, which tends to be more cyclical, this decline in services may be structural as the virus changes our consumer preferences in general, but also in light of the new social distancing requirements. Some of these services are never coming back. This is deflationary, or at minimum it is dis-inflationary overall for the economy.

Services price inflation tends to be much higher than manufacturing price inflation. This paper from the ECB has documented that this is a feature for both EU and US economy and has been prevalent for the past 20 years.

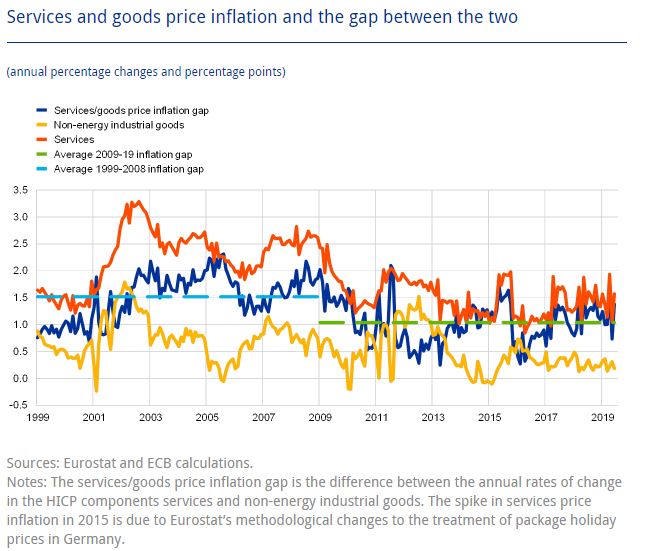
However, as the paper demonstrates, the gap between the services and good price inflation has been narrowing recently, starting with the 2008 crisis. I believe that after the Covid crisis, the gap may even disappear completely.

For a sustained rise in inflation, we need a ‘permanent’ rise in free government handouts as that would increase the chance of some of it eventually hitting the real economy. Reality is that, even if this happens, the output gap is so big that inflation may take a lot longer to materialize than people expect. However, anything that shrinks the supply side of the economy (supply chains breakdown, regulations, natural disasters, social disorder, etc.) would have a much bigger and direct effect on inflation.

Bottom line is, as the speed of technological advances accelerates, and with no barriers to that, inflation in the 21st century becomes much more a supply-side than a demand-side (monetary) phenomenon.

Monetary underwhelms, but fiscal makes all the difference

23 Tuesday Jun 2020

Posted by beyondoverton in Monetary Policy, UBI

≈ 1 Comment

Tags

fiscal policy

Despite the fanfare in the markets, the Federal Reserve’s monetary stimulus, on its own, is rather underwhelming compared to the equivalent during the 2008 financial crisis. What makes a difference this time, is the fiscal stimulus. The 2020 one is bigger than the 2008 one; but more importantly, it actually creates net financial assets for the private sector.

Monetary Stimulus

  • Fed’s balance sheet has increased by 73% since the beginning of 2020. In comparison, it increased by 109% between August’08, the month before Lehman went bust and most major programs started, and March’09, the month when the stock market bottomed. Actually, by the time QE3 ended, in September 2014, Fed’s balance sheet had increased by 385% compared to since before the crisis.
  • Commercial bank reserves were at 9% of their total assets before the Covid crisis and are sitting at 15% now, a 94% increase. In the aftermath of the 2008 crisis, on the other hand, bank reserves tripled from August’08 to March’09 and increased 10x by September’14. Relative to banks’ total assets, reserves were just at 3% before the crisis but rose to 20% by the end of QE3.
  • Bank deposits were at 75% of their total assets in January’20 and are at 76% now, a 17% increase. Deposits were at 63% before the 2008 crisis, had declined to 60% by March’09, and eventually rose to 69% of banks total assets. Overall, for this full period, commercial bank deposits rose by 49%.

In percentage terms, Fed’s balance sheet rose less during the 2020 crisis than during the 2008 crisis and its aftermath.

Commercial bank reserves were a much smaller percentage of banks’ total assets before the 2008 crisis than before the 2020 crisis, but by the end of QE in 2014, they were bigger than today.

Banks started deleveraging post the 2008 financial crisis (deposits went up as a percentage of total assets) and continue to deleverage even now.

On the positive side, however, the Fed has introduced four new programs in 2020 that did not exist in 2008, Moreover, unlike 2008, they are directed at the non-financial corporate sector, i.e. much more targeted lending than during the financial crisis.

Nevertheless, very little overall has been used of the facilities currently, both in absolute terms (the new ones), and compared to 2008.

The percentage use of facilities in 2020 vs 2008 ranges from 0% for TALF to 15% for MMMLF, with a weighted average (by size) of about 5% for all facilities. In other words, if one takes financial markets as a marker, very little of these facilities is likely to be used going forward.

In fact, looking at the performance of financial assets, the market is not only telling us we are beyond the worst-case scenario, but, as equities and credit have hit all-time highs, it seems we are discounting a back-to-normal outcome already. It took the US equity market about four years after the 2008 crisis to reach its previous peak in 2007. In the 2020 crisis, it took two moths!

Following the 2020 Covid crisis, monetary policy so far is much less potent than following the 2008 financial crisis. Taking into account the full usage of Fed’s facilities announced in 2020, the growth rate in both Fed’s balance sheet and commercial bank reserves by the end of 2020 will likely match those for the period Auguts’08-March’09. But it has a long way to go to resemble the strength of monetary policy during QE1,2.3. Given that US equities only managed to bottom out by March’09, in an environment of much stronger monetary policy on the margin than today, means that their extraordinary recovery during the Covid crisis has probably borrowed a lot from the future.

Fiscal Stimulus

The Coronavirus Aid, Relief, and Economic Security (CARES) Act of 2020 is much bigger than the American Recovery and Reinvestment (ARR) Act of 2008, both in absolute terms and in percentage of GDP.

However, what really makes the difference, is the fact that the CARES Act has the provision to increase the private sector’s net assets. This is done through two of the programs. The SBA PPP allows for about $642Bn of loans to small businesses. If eligibility criteria are met, the loans can be forgiven. The Recovery Rebates Program allows for the disbursement of $1,200pp ($2,400 per joint filers plus $500 per dependent child). Nothing like this existed during the 2008 financial crisis.

Most of the loans through the SBA PPP have already been made, and about $112Bn are forgiven. So, there is another maximum of $532Bn which could still be forgiven (deadline is end of 2020). The Employment Rebate Programs is about $300Bn in size.

Just the size of these two programs can potentially be as big as the ARR Act was, in absolute terms. They create the possibility for the private sector to formally receive ‘income’, even though it is a one-off at the moment, without incurring a liability. Some of the other programs, like Tax Relief, are a version of that, but instead of acquiring an asset, the private sector receives a liability reduction – not exactly the same thing.

This is important. Until now, the private sector could receive income either in exchange for work, or, as it became increasingly more common starting in the late 1990s, with the promise of paying it back (in the form of debt). This now could be changing.

The Fed, for example, can not do that. Its mandate prevents it to ‘spend’ and only to ‘lend’. Until 2020, the Fed’s programs were essentially an exercise of liquidity transformation and a duration switch (the private sector reduced duration – mostly UST, MBS – and increased liquidity – T-Bills and bank reserves). There was no change in net assets on its balance sheet; the change was only in the composition of assets. The more recent programs introduced direct lending to the non-financial sector, still no net creation of financial assets, but a much broader access to the real economy.

In a sense, while the CARES Act comes closer to the concept of Helicopter Money or Universal Basic Income (UBI), the monetary stimulus of 2020 is moving closer to the concept of Modern Monetary Theory (MMT).

In that sense, while the reaction of financial markets to the monetary stimulus may not be deemed warranted, taking into account the innovative structure of the fiscal stimulus, asset prices overreaction becomes easier to understand. Still, I believe the market has discounted way too much into the future.

There is always a dichotomy between financial markets and the economy but, it seems that currently, the gap is quite stark between the two. It could be that the market is comfortable with the idea that, in a worst-case scenario, the authorities have plenty of ammunition to use, in the case of both the existing facilities as well as new stimulus.

I disagree. While 2008 was a financial crisis, in 2020, we are dealing with an exogenous real shock, which is independent of financial market performance. In 2008, the market eventually pulled the economy higher. This year, especially if a second Covid wave hits, as it is now becoming increasingly likely, the authorities will have to come good on all their promises to use these facilities, maybe to the full, or the market would be in trouble.  And therein lies the problem. Will the US political environment allow for that to happen?

I have been in the past quite critical of the prospect of fiscal policy to save the day. Regardless of how financial markets perform going forward, this time, however fiscal policy definitely stands a chance.

Corona Virus market implications

29 Saturday Feb 2020

Posted by beyondoverton in Asset Allocation, China, EM, Equity, Monetary Policy, Politics, UBI

≈ 1 Comment

Tags

corona virus

Following up on the ‘easy’ question of what to expect the effect of the Corona Virus will be in the long term, here is trying to answer the more difficult question what will happen to the markets in the short-to-medium term.

Coming up from the fact that this was the steepest 6-day stock market decline of this magnitude ever (and notwithstanding that this was preceded by a quite unprecedented market rise), there are two options for what is likely to happen next week:

  1. During the weekend, the number of Corona Virus (CV) cases in the West shoots up (situation starts to deteriorate rapidly) which causes central banks (CB) to react (as per ECB, Fed comments on Friday) -> markets bounce.
  2. CV news over the weekend is calm, which further reinforces the narrative of ‘this too shall pass’: It took China a month or so, but now it is recovering -> markets rally. 

While it is probably obvious that one should sell into the bounce under Option 1, I would argue that one should sell also under Option 2 because the policy response, we have seen so far from authorities in the West, and especially in the US, is largely inferior to that in China in terms of testing, quarantining and treating CV patients. So, either the situation in the US will take much longer than China to improve with obviously bigger economic and, probably more importantly, political consequences, or to get out of hand with devastating consequences. 

It will take longer for investors to see how hollow the narrative under Option 2 is than how desperately inadequate the CB action under Option 1 is. Therefore, markets will stay bid for longer under Option 2.

The first caveat is that if under Option 1 CBs do nothing, markets may continue to sell off next week but I don’t think the price action will be anything that bad as this week as the narrative under Option 2 is developing independently. 

The second caveat is that I will start to believe the Option 2 narrative as well but only if the US starts testing, quarantining, treating people in earnest. However, the window of opportunity for that is narrowing rapidly.

What’s the medium-term game plan?

I am coming from the point of view that economically we are about to experience primarily a ‘permanent-ish’ supply shock, and, only secondary, a temporary demand shock. From a market point of view, I believe this is largely an equity worry first, and, perhaps, a credit worry second.

Even if we Option 2 above plays out and the whole world recovers from CV within the next month, this virus scare would only reinforce the ongoing trend of deglobalization which started probably with Brexit and then Trump. The US-China trade war already got the ball rolling on companies starting to rethink their China operations. The shifting of global supply chains now will accelerate. But that takes time, there isn’t simply an ON/OFF switch which can be simply flicked. What this means is that global supply chains will stay clogged for a lot longer while that shift is being executed. 

It’s been quite some since the global economy experienced a supply shock of such magnitude. Perhaps the 1970s oil crises, but they were temporary: the 1973 oil embargo also lasted about 6 months but the world was much less global back then. If it wasn’t for the reckless Fed response to the second oil crisis in 1979 on the back of the Iranian revolution (Volcker’s disastrous monetary experiment), there would have been perhaps less damage to economic growth.  Indeed, while CBs can claim to know how to unclog monetary transmission lines, they do not have the tools to deal with supply shocks: all the Fed did in the early 1980s, when it allowed rates to rise to almost 20%, was kill demand.

CBs have learnt those lessons and are unlikely to repeat them. In fact, as discussed above, their reaction function is now the polar opposite. This is good news as it assures that demand does not crater, however, it sadly does not mean that it allows it to grow. That is why I think we could get the temporary demand pullback. But that holds mostly for the US, and perhaps UK, where more orthodox economic thinking and rigid political structures still prevail. 

In Asia, and to a certain extent in Europe, I suspect the CV crisis to finally usher in some unorthodox fiscal policy in supporting directly households’ purchasing power in the form of government monetary handouts. We have already seen that in Hong Kong and Singapore. Though temporary at the moment, not really qualifying as helicopter money, I would not be surprised if they become more permanent if the situation requires (and to eventually morph into UBI). I fully expect China to follow that same path.

In Europe, such direct fiscal policy action is less likely but I would not be surprised if the ECB comes up with an equivalent plan under its own monetary policy rules using tiered negative rates and the banking system as the transmission mechanism – a kind of stealth fiscal transfer to EU households similar in spirit to Target2 which is the equivalent for EU governments (Eric Lonergan has done some excellent work on this idea).

That is where my belief that, at worst, we experience only a temporary demand drop globally, comes from, although a much more ‘permanent’ in US than anywhere else. If that indeed plays out like that, one is supposed to stay underweight US equities against RoW equities – but especially against China – basically a reversal of the decades long trend we have had until now.  Also, a general equity underweight vs commodities. Within the commodities sector, I would focus on longs in WTI (shale and Middle East disruptions) and softs (food essentials, looming crop failures across Central Asia, Middle East and Africa on the back of the looming locust invasion). 

Finally, on the FX side, stay underweight the USD against the EUR on narrowing rate differentials and against commodity currencies as per above.

The more medium outlook really has to do with whether the specialness of US equities will persist and whether the passive investing trend will continue. Despite, in fact, perhaps because of the selloff last week, market commentators have continued to reinforce the idea of the futility of trying to time market gyrations and the superiority of staying always invested (there are too many examples, but see here, here, and here). This all makes sense and we have the data historically, on a long enough time frame, to prove it. However, this holds mostly for US stocks which have outperformed all other major stocks markets around the world. And that is despite lower (and negative) rates in Europe and Japan where, in addition, CBs have also been buying corporate assets direct (bonds by ECB, bonds and equities by BOJ).

Which begs the question what makes US stocks so special? Is it the preeminent position the US holds in the world as a whole? The largest economy in the world? The most innovative companies? The shareholders’ primacy doctrine and the share buybacks which it enshrines? One of the lowest corporate tax rates for the largest market cap companies, net of tax havens?… 

I don’t know what is the exact reason for this occurrence but in the spirit of ‘past performance is not guarantee for future success’s it is prudent when we invest to keep in mind that there are a lot of shifting sands at the moment which may invalidate any of the reasons cited above: from China’s advance in both economic size, geopolitical (and military) importance, and technological prowess (5G, digitalization) to potential regulatory changes (started with banking – Basel, possibly moving to technology – monopoly, data ownership, privacy, market access – share buybacks, and taxation – larger US government budgets bring corporate tax havens into the focus).

The same holds true for the passive investing trend. History (again, in the US mostly) is on its side in terms of superiority of returns. Low volatility and low rates, have been an essential part of reinforcing this trend. Will the CV and US probably inadequate response to it change that? For the moment, the market still believes in V-shaped recoveries because even the dotcom bust and the 2008 financial crisis, to a certain extent, have been such. But markets don’t always go up. In the past it had taken decades for even the US stock market to better its previous peaks. In other countries, like Japan, for example, the stock market is still below its previous set in 1990.

While the Fed has indeed said it stands ready to lower rates if the situation with the CV deteriorates, it is not certain how central bankers will respond if an unexpected burst of inflation comes about on the back of the supply shock (and if the 1980s is any sign, not too well indeed). Even without a spike in US interest rates, a 20-30 VIX investing environment, instead of the prevailing 10-20 for most of the post 2009 period, brought about by pulling some of the foundational reasons for the specialness of US equities out, may cause a rethink of the passive trend.  

The type of credit creation matters

04 Monday Nov 2019

Posted by beyondoverton in Debt, Monetary Policy, Politics, UBI

≈ Leave a comment

Credit impacts the real economy in a different way depending on whether it is to households or to corporates (see Atif Mian’s work, also his interview here). Very generally speaking, credit to households affects the economy directly through the demand-side channel, while credit to corporates – through the supply-side channel directly, and only then, potentially, indirectly through the demand-side channel.

Household debt to GDP was flat for two decades between mid-1960s and mid-1980s; and then it doubled; corporate debt for GDP, on the hand, was flat also for two decades after the S&L crisis, and even now it is only a few per cents higher. But the demand-side reduction from the household debt channel post 2008 is rather unique.

Given that the US was running a negative output gap for most of the period post 2008 (and it might still do, even though official estimate is for a small positive), it was the demand-side that needed some catching up to. Instead, the opposite was essentially happening: credit to households was decreasing relative to credit to corporates. As far as credit was concerned, it was primarily the supply side that was getting stimulated (of course, the question is how much stimulus was really created given that a lot of the corporate debt went to share buybacks).

The other theory, one to which I subscribe, is that the modern economy is essentially always experiencing a demand gap. When real wages stopped growing in the 1990s, post the the financial liberalization of the 1980s, household credit experienced a massive run-up. The demand gap left from the stagnation in real incomes was filled with household debt. Until the sudden stop in 2008.

Household debt to GDP did not grow between 1960s-1980s but real household income did, so there was no demand gap either. Post 2008, though, neither of these two options were available which left the US economy in a demand insufficiency. The ‘stimulus’ provided was mostly through the supply side with very little follow through into the demand side which meant lackluster economic growth.

The bottom line is that the type of credit creation matters. The central bank affects directly only the supply of credit (and in some cases, even less so) thus, it has limited ability (none?) to decide on whether credit goes to firms or households. We may get a lot more from lower interest rates if policy makers start thinking more holistically about the whole process of credit creation. Banks do not care where credit goes (why should they?) as long as they get their money back.

But with overall debt in the economy climbing higher and higher, it is essential to think how we can get the most out of it. And if the market can’t do that (it can’t), someone else should step in.

All this does not mean that US households should get even more indebted! On the contrary, the decline in household debt to GDP is good news only if it were also followed by a similar rise in real household income. And it the private market can’t do that either (it seems, it can’t), then we need to rely on the official sector to take on that burden.

Plenty of liquidity but scarce money

05 Thursday Oct 2017

Posted by beyondoverton in blockchain, Debt, Monetary Policy, UBI

≈ 3 Comments

“All the perplexities, confusion, and distress in America arise…from downright ignorance of the nature of coin, credit and circulation” John Adams in a letter to  Thomas Jefferson

1)We should have never ‘put together’ “store of value” and “medium of exchange”.    

2) If something has intrinsic value which is expected to go up in time, it will be hoarded and exchanged less often.

3)’Money’ is a “unit of account” which we ‘exchange’, in order to efficiently get the things we really need and want in life.

4)Inflation/Deflation are simply measures of whether ‘money’ is abundant or scarce relative to the economic activity we desire.

5)In the economic system we have created, purchasing power is gained either through paid work or through credit.

7)As long as companies earn a profit, they retain more ‘money’ than they distribute in wages and other payments, thus there is insufficient medium of exchange to meet the supply of goods.

7)Even if companies invest the profit in new projects, this only adds to the previous supply-demand imbalance unless new medium of exchange is added endogenously in the form of credit.

8)Advances in technology make the old paradigm of Work=Job=Income obsolete; purchasing power is lost.

9)Credit only makes the scarcity of ‘money’ more acute because new medium of exchange needs to be added just to pay the interest on the debt; a vicious cycle develops.

10)This credit/debt cycle also eventually comes to a natural end (2008); no more purchasing power can be added even endogenously.

11)If we want to keep the current economic system going, we need to find a new way of generating ‘purchasing power’.

12)But if the paradigm has shifted, normalization is meaningless; instead of going back to something that does not work, let’s look forward.

12)’Helicopter money’ has an, unjustifiably, bad reputation historically.

13)UBI is politically unfeasible to implement in a large country with open borders.

14)The problem with them in the past has been our lack of knowledge of existing economic activity, and thus our inability to disburse the right amount of purchasing power needed.

15)M≠PxT, so we invent V, in order to MxV=PxT

16) Both of them, however, are great ideas which need to be put in the context of our existing institutional framework.

17)The central bank opening its balance sheet (CBDC) to the public at large is the next step in monetary/fiscal policy.

18)Blockchain, as in a large, open, decentralized, distributed, real-time database of all economic transactions, is the digital equivalent of ‘GDP’ of the industrial era.

19)The Fisher’s equation above then takes the form of CBDC=Blockchain, ‘money’ matches economic activity.

What if central banks gave the QE money to the people?

03 Tuesday Oct 2017

Posted by beyondoverton in blockchain, Debt, Monetary Policy, Questions, UBI

≈ Leave a comment

I would not be blindfolded by the fact that the US is trying to go back to ‘normal’ with the Fed on a rate-raising spree. ‘Normal’ changed a long time before 2008. You cannot go back to ‘normal’ with a broken monetary transmission mechanism. We can create all the money in the world but if it goes in the hands of the few, if it is subsequently ‘hoarded’ and if it cannot  reach the end consumer because Work≠Job≠Income (whether that is because of technology, globalization or whatever) or because the credit channel is closed (the end of the private debt super-cycle in 2008), the economy is not going to go anywhere. And if there is little demand because there are not enough mediums of exchange, aka money, circulating in the economy, optimizing production is a waste of time and resources.

Instead of focusing on going back to a ‘normal’ interest rate policy, a forward-looking central bank would be looking into the opportunity presented by the rise of the blockchain technology and the subsequent spread of digital cryptocurrencies. The latter are a direct response to the broken down monetary transmission mechanism: if the traditional mediums of exchange do not circulate in the economy, people are devising their own ways of exchanging goods and services.

The interest-rate cycle is something of the past now. If the financial crisis of 2008 did not make it obvious, perhaps, we have to wait for the next one, which would be here like clockwork as policy makers embark on the policy of ‘normalization’. But there is some hope that some central banks are looking into ways to introduce a digital currency of their own and opening their balance sheet to the public at large.

Back of the envelope calculation shows that if the money spent on buying financial  assets by the central banks of UK, US and Japan, was instead disbursed directly to the people, working wages would have risen substantially.

Between 2008 and 2016, central banks’ balance sheets have risen by 360% in the UK, 99% in the US and 280% in Japan.

Source: Bank of England, US Federal Reserve, Bank of Japan

At the same time, over this period, nominal wages have risen by only 14.8% in the UK, 18.4% in the US and actually fallen by 2.9% in Japan! In 2016, the average annual wage in the UK was GBP 34,142, in the US – USD 60,154 and in Japan – Yen 4,425,380.

Source: OECD

Japan is peculiar also because its working age population declined by 7.4%, while US’ and UK’s rose by 4.5% and 2.7%, respectively, during this period.

Source: OECD

I took the actual change in central bank balance sheets and divided it over the average working age population between 2008 and 2016. If this money could have been disbursed directly to the people, workers would have received a lump sum of GBP8,574, USD10,997, Yen4,430,424 over the period.

Let’s imagine that this lump sum was disbursed to the working age population at the end of 2016. Compared to 2008, their wages in 2016 would then have been higher by 44% (UK), 40% (US), 98% (Japan)!

If wages could indeed ‘miraculously’ rise by almost half in the UK and US and almost double in Japan over this 8 year period, what are the chances that we would still be stuck around 2% inflation in the US and UK and around 0% in Japan? Where would GDP be?

This is a very simple exercise. Undoubtedly real life is much more complicated that this and it is rarely black and white. Moreover, this would have been a lump sum disbursement, a one-off boost to income, and not a permanent rise in wages. Consumer behavior in this case, Ricardian equivalence, etc., would have been very different from a situation with a permanent rise in wages.

However, instead of patting ourselves on the back that things could have been much worse had the central banks not backstopped the financial system by buying financial  assets, can we not also think how they could  have also been much better if we found a better use for the money miraculously created out of thin air? If we could create money out of thin air to boost financial asset prices, is it really not possible to devise a way whereby the consumer also gets a permanent rise in income? Can we have an adult conversation about the effects of such an experiment without resorting to the taboos of the past? Can we include people other than economists in this conversation?

The free market may be the best and most efficient optimization model available so far to us, but what if we are optimizing the wrong variable?

Corporate vs. state UBI

04 Friday Aug 2017

Posted by beyondoverton in UBI

≈ Leave a comment

It has been amusing to observe how people keep have been getting Japan wrong throughout the years, both fundamentally, when it comes to society’s structure and wealth, as well as asset price-wise.

For example, the widow-maker’s trade: betting on higher JGB yields ‘for ever’ not realizing the power of technology to create superfluous extra (surplus) capital and labor in peace time. In fact, if one thinks of the famous hockey stick chart of human progress (also the chart used by Kurzweil to show Singularity), the chart of global developed markets sovereign yields going back centuries has a similar shape but in the opposite direction: steep and high 2000 years ago to flat and zero now. You could say, the higher the “culture” the lower the yield.

Similar for stock prices: people have been betting on higher stock prices not realizing the Japanese corporates’ eroding profitability due to the hidden cost of BS jobs and corporate Universal Basic Income (both represented in the low unemployment figures, see below).

Demographics plays a very small role in GDP because as society progresses labor’s utility in the production function has greatly diminished at the expense of technology.  It is not that dissimilar on the consumption side either. In the post-consumerism (increasingly digital) society that we live in, the young are consuming even less material things (the ones that matter for GDP) than the old. In Japan specifically, demographics has long ago stopped to matter.

Productivity, on the other hand, is a function of both labor and technology. We can very easily increase productivity when we substitute labor with technology. We have chosen to do the opposite, despite plenty of advances in technology, however, because we do not have an alternative method of distributing wealth rather than Work=Job=Income. In fact, if we choose to increase productivity right now while using the same old method of wealth distribution, inequality will rise even more.

Demographics and productivity are basically remnants of the old industrial model of classical economics – the same model which only looks at how to increase GDP without regard to human wealth being (again, it is very easy to increase GDP if that is our goal but that does not mean society would be better off).

Japan’s GDP per worker (i.e. a much narrower definition than GDP per capita) is and has been actually higher than the equivalent in the US during Japan’s supposedly lost decades (and that is despite a very slow adoption of technology – slower than what it could have been given an alternative wealth distribution method).

I can see a lot of similarities between how Japan has decided to structure its society and how some rich oil countries in the Middle East have done the same. Japan uses technology and the corporates to distribute wealth, while in the Middle East, is the state distributing and the source of wealth is abundant oil (note, there is a similar UBI mechanism also in Alaska and Norway).

There are numerous other UBI experiments going on in many different countries and cities. I wonder if the fact that society is very homogeneous in Japan and the Middle East help with UBI being more accepted: here I mean the right to citizenship being very strict and narrow. For example, in the Middle East, where technology is not so well advanced yet, it is foreigners who do most of the everyday jobs; Japan could easily use more robots to do the work. In both cases, only citizens would receive, unconditionally, the benefits of (someone else’s) labor and the spoils of technology or the luck of natural resources.

I am struggling to reconcile this new reality with the idea that in the past immigration and an open society have greatly contributed to human advancement by allowing for diversity and the free dissemination of knowledge. Now open borders seem to be a hurdle for any county which wants to introduce this new model of wealth distribution. In addition, ideas disseminate much easier due to the Internet and open source also allows anyone to benefit from new inventions.

Oil (and all natural resources) are finite, while demographics means Japan is slowly running out of people to employ. None of this is a problem if the Middle East invests its substantial wealth in labor saving technologies (and constantly innovates) or if Japan changes it wealth distribution model. Is a country a free rider if it chooses to close its borders and take care only of its own citizens? What is the right model to structure society so that it works for everyone not just for only a small number of countries?

Subscribe

  • Entries (RSS)
  • Comments (RSS)

Archives

  • January 2023
  • December 2022
  • November 2022
  • August 2022
  • February 2022
  • April 2021
  • November 2020
  • October 2020
  • September 2020
  • August 2020
  • July 2020
  • June 2020
  • May 2020
  • April 2020
  • March 2020
  • February 2020
  • January 2020
  • December 2019
  • November 2019
  • October 2019
  • May 2019
  • March 2019
  • February 2019
  • January 2019
  • December 2018
  • November 2018
  • October 2018
  • September 2018
  • August 2018
  • June 2018
  • May 2018
  • March 2018
  • February 2018
  • January 2018
  • November 2017
  • October 2017
  • September 2017
  • August 2017
  • July 2017
  • June 2017

Categories

  • AI
  • Asset Allocation
  • blockchain
  • China
  • De-urbanization
  • Debt
  • Decentralization
  • EM
  • Energy
  • Equity
  • FX
  • g88kboy
  • Monetary Policy
  • Politics
  • Questions
  • Quotes
  • The last man standing will laugh
  • Travel
  • UBI
  • Uncategorized
  • VR

Meta

  • Register
  • Log in

Blog at WordPress.com.

  • Follow Following
    • BeyondOverton
    • Join 73 other followers
    • Already have a WordPress.com account? Log in now.
    • BeyondOverton
    • Customize
    • Follow Following
    • Sign up
    • Log in
    • Report this content
    • View site in Reader
    • Manage subscriptions
    • Collapse this bar
 

Loading Comments...