Apple is up more than 70% this year; Microsoft – 50%. Together they have contributed almost 40% to the more than 30% rise in the Nasdaq.
Facebook, Google and Amazon, the other heavy weights in the index, have together contributed about 19% to this year’s performance.
Just five companies have contributed almost 60% to this year’s Nasdaq returns!
Apple and Microsoft together have bought back almost $85Bn of their own shares this year. Amazon does not buy back its shares (yet). Google started in 2015 and has bought back $8Bn this year. Facebook started buying back its shares last year and has bought back about $13Bn this year.
Intel, Comcast, Nvidia, Costco, Charter Communications bring up the top 10 with a combined share buyback of around $20bn. Costco, Charter Communications and, to a certain extent, Nvidia, are actually, good examples of Yardeni’s claim that companies mostly buy back shares to avoid dilution. Sadly, that is not the case for the heavy hitters in the list, the ones doing most of the buybacks, and thus the ones with a disproportionate influence on index performance. For example, just among those five, Intel and Comcast have done 3/4 of the combined buybacks.
There is a big difference when it comes to Apple and Microsoft, however.
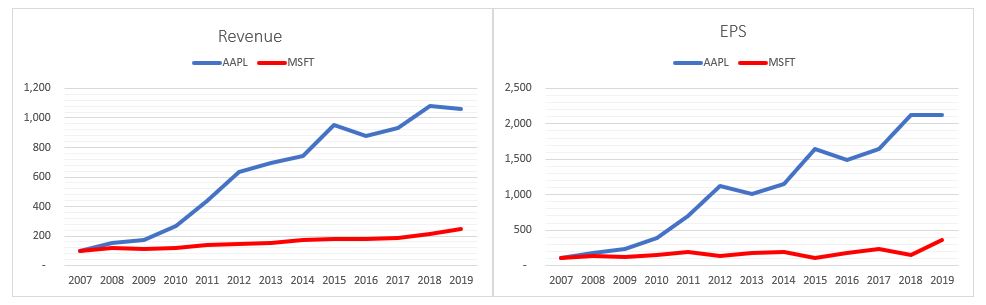
Since 2007 Apple has outperformed Microsoft in both Revenue growth (former’s increased 10x, latter’s – about 2.5x) and EPS growth (20x increase vs. 3.5x). In 2007 Apple’s revenue was about half of Microsoft’s. In 2010 they were the same. Today Apple’s revenue is more than 2.5x bigger than Microsoft’s, however it topped in Q3’2018, while Microsoft’s is still growing.
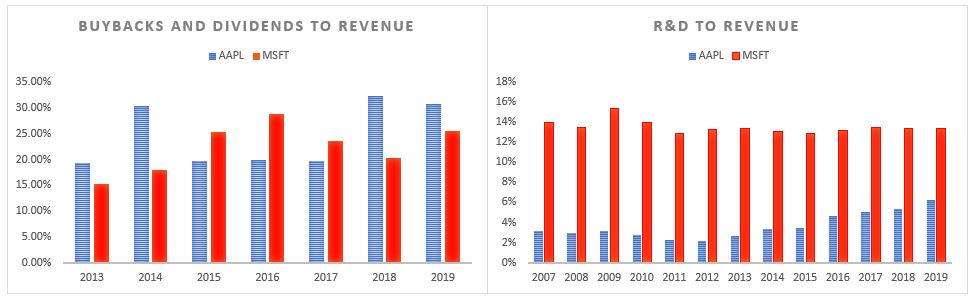
Apple only started paying dividend in 2010 and buying back its stock in 2011. Since then, both have spent about 25% of their top-line revenues, on average, on shareholders payouts. However, Microsoft spends considerably more on R&D as a % of revenue than Apple.
Apple managed to reduce its share count by almost 30% since 2012. Microsoft reduced its share count by a ‘mere’ 22% since 2007. And it shows. Apple’s share price has massively outperformed Microsoft’s since 2007. Of course, there are other factors in place (the IPhone came in 2007) and maybe it is just a coincidence that the out-performance started in 2010, when Apple began giving cash back to shareholders!
Bottom line: Make sure you have at least AAPL and MSFT share price on your screens all the time into year end.
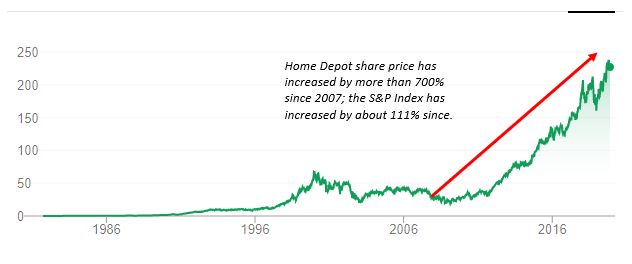
Home Depot cuts its 2019 forecast after sales miss; shares drop the most since 2008.
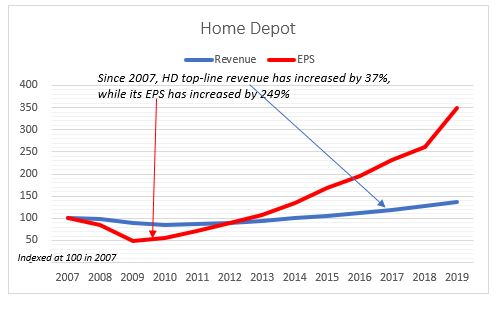
Since 2007, Home Depot’s top-line revenue has increased by 37%, while its EPS has increased by 249%, almost 7x more.
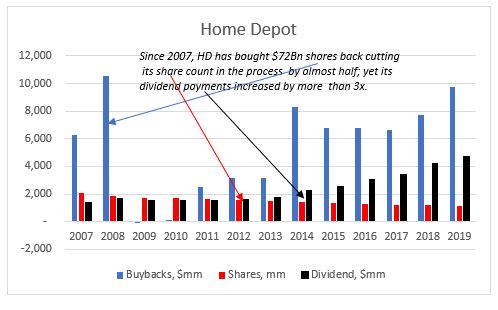
Since 2007, Home Depot has bought $72Bn shares back, one of the largest share buyback programs out there, cutting its share count in the process by almost half; yet its dividend payments increased by more than 3x.
Emphasis on the fact that Home Depot topped analysts’ expectations for earnings but sales fell short. Which is exactly the story of our times: Easier to push up EPS through the share count (buybacks) than through top-line revenue growth. Management also gets paid on EPS, not revenue.
And the cherry on the cake: Home Depot’s share price has increased by more than 700% since the end of 2007; the S&P Index has increased by about 111% since then.
One would have thought that after so many years of Home Depot using the same technique to ‘score a home run’, investors would have understood the tactic and re-priced its valuation.
The idea about this post came after listening to Ben Hunt’s and Ed Yardeni’s recent Ritholz Wealth Management podcasts. While, in general, I do agree with the conclusion Ben reaches, I thought looking at just two individual companies’ share buyback programs, as he did in two separate posts, is perhaps a bit too narrow. At the same time, I was doubtful whether Yardeni’s approach of going to the opposite extreme of looking at all S&P 500 companies and taking the average is equally that ‘practical’.
Ed Yardeni is a top strategist but his claim in “Exposing the big lie about stock buybacks” that the majority (2/3) of US stock buybacks go to cover employee stock issuance, even if true on an aggregate level, does not change the fact that buybacks are possibly the main driver of US stock out-performance.
“The current source for equity issuance data in the Financial Accounts of the United States does not fully incorporate issuance to employees by public corporations. Staff is exploring how best to reflect such issuance activity in future releases.”
Emphasis on fully. What does this mean? Look at p.68, table F.223 of the latest Flow of Funds data. So, line 2 (‘Nonfinancial corporate business’) does not include ESOPs (and other equity compensation plans)? I don’t think that changes the demand-supply dynamics. Share grants are different from IPOs and buybacks as they are a non-cash flow item, as in the former there is no exchange of cash at issuance and the effect on the supply of shares happens only when those are sold by the employees in the secondary market. They are a balance sheet item. So mot likely, they will be registered either in line 16 (‘Household sector’) or in line 31 (‘Broker and dealers’) at the point of sale.
In any case, in the Flow of Funds data, ‘Net Issue‘ and ‘Net Purchases‘ have to balance, if we start tinkering with the net issuance (line 2), as in, assume that actually US corporates net bought back fewer shares to account for the ESOP (and other equity compensation programs), then we have to also change something on the net purchases side (line 15 and below). My guess is that ESOPs are incorporated in the Flow of Funds data but not in the net issuance section (with a positive sign), rather in the net purchases section (negative sign). I think this is the more likely scenario in what the Fed official meant as “not fully incorporating ESOP” in that data.
I could be wrong on this, so looking forward to some clarity from the Fed in the future publications of the Flow of Funds data.
I have no reason to doubt indeed that on average for all the companies in the S&P 500, 2/3 of share buyback activity goes towards avoiding dilution from share issuance on the back of employee compensation plans. However, this is not true for the largest corporate share buybacks programs in terms of dollar amounts conversion. And because of their market weight, this is where the big impact from buybacks on the S&P 500 comes from (on average, the price change of these companies’ share price is double that of the S&P 500 in the last 8 years).
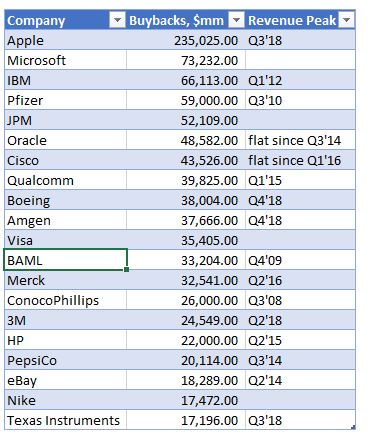
If we take the 20 largest share buybacks programs and look at the same period 2011-2018 which also Yardeni data covers, employee stock compensation is only about 14% of the value of the corporate share buybacks. The ratios vary from company to company but just to give you an example, for Apple, which has, by far, the largest share repurchase program of all companies in the US, employee stock compensation is on average about 11% of total buybacks. The banks have the largest ratio, at around 35%, while Boeing and Visa have the lowest, around 4%.
Selected US Share Buybacks
Those large share buyback programs have reduced the companies share count by about 18% on average between 2011 – 2018. In some of the larger buybacks, like Apple, Pfizer etc., the share count is reduced by almost 25%. So, even if indeed some of the share buyback activity is on the back of employee compensation, there is still substantial reduction in the share count which should have an effect on share prices and on performance indicators per share.
ESOPs are actually not that prevalent in US businesses. In fact, only about 10% of the private workforce is involved in such programs and only about 10% of the publicly traded companies have them. Public companies, however, have other equity compensation programs but they are mostly geared to senior management. There are three kinds of equity awards that public companies give: restricted shares, share options and performance shares.
Share options had been the original and the most popular form of executive compensation until the mid-2000s or so. Their use was limited in the 1960-1970s, however, as the stock market languished and went nowhere (which is when companies started giving out restricted shares, which, even though they vest, they do not require either any upward movement of the share prices to ‘make money’ – as options do, or beating any performance targets – as performance shares do).
However, by the late 1990s, with the stock market rising substantially on the back of the financialization of the US economy which started in the 1980s with the doctrine of shareholder primacy and the accompanying surge of corporate share buybacks (SEC Rule 10B-18), the popularity of stock options surged to 75% of all executive compensation. By the mid-2000s, though, three things happened which affected adversely the use of stock options in executive compensation programs: 1) in 2006 the accounting rules changed, resulting in charge against earnings for the grant of options; 2) during the crisis of 2008, stock markets fell substantially; 3) The Dodd-Frank Act of 2010 now requires a say-on-pay vote. As a result, organizations such as Institutional Shareholder Services, now have a much greater influence over executive pay. Therefore, performance shares have become the dominant source of executive compensation.
There are two points I want to make here. First, the concern over exuberant executive pay is not something new – regulators have been looking into it since at least the 2000s. Second, because the performance targets are tied to companies’ EPS, the changes made to the executive compensation plans, unfortunately, fall short of their target: senior management can legally find a loophole to still continue to disproportionately increase their compensation. What do I mean ‘disproportionately’? I mean relative to other employees’ compensation and to companies’ top line growth.
Which brings me to a second claim made by Yardeni, namely that S&P 500 companies’ EPS growth is only about 1% lower than their total earnings growth. Again, I have no reason to doubt that, as a whole, this is correct: on average across all the S&P500 companies, there may not be much ‘smoothing out’ of EPS through share buybacks . But looking at the largest share buybacks programs, that’s not the case.
Of those, on average over the 2011-2018 period, top line net operational income growth is about half of EPS’s growth. What I found is that while top line income growth is somewhat similar to the average of the whole S&P 500 index (11.1% vs 8.1%), EPS growth in the largest share buyback companies was much higher.
Again, the numbers vary. For some (Microsoft, Nike), actually, average top-line growth is slightly higher than EPS growth. On the other spectrum, companies like Pfizer and Merck have had much smaller top line growth rates than EPS ones. Apple, having the largest share buyback program, has a more respectable 23% average annual top line operational income growth rate vs 27% EPS growth rate. But still very far from the average for the S&P 500 index company.
In fact, for majority of the companies in that sample, their revenues had peaked already some time ago. That did not stop companies continuing with their share buyback programs. In fact, some like Apple, Cisco, Amgen, BAML, Merck, Pfizer have substantially increased their spend on share buybacks thereafter.
Selected US Share Buybacks
Given the above, it is not unreasonable to assume that indeed senior management in these companies is ‘wrongly’ incentivized to authorize more buybacks despite lackluster top-line operational performance in order to benefit from the obviously better EPS performance.
But it is not all doom and gloom when it comes to share buybacks. Employment
has risen on average by 26% over that period for those companies. However, that
is really concentrated in a few big companies like Apple, Microsoft and Nike
(for example, Apple has doubled its employment between 2001-2018). A lot of
companies, the industrials (Pepsico, Merck, Pfizer, Texas Instruments) and the
banks (JPM, BAML) have actually marginally reduced employment.
Finally, while it is reasonable to suppose that a lot of the increased activity
in buybacks is linked to senior executives’ compensation packages, it is a lot
more difficult to make the claim that they happen at the expense of R&D. For
example, comparing Apple to Microsoft – massive difference when it comes to
R&D spending vs buybacks. While Apple has spent a lot less on R&D vs
buybacks in the last 8 years (in fact $175Bn less!), Microsoft has spent a lot
more ($19Bn). And while Apple spends just about 3% of its revenue on R&D, Microsoft
spends about 13%.
There is a divergence among the industrialists as well, with Texas
Instruments, Boeing and Amgen spending substantially more on buybacks relative
to R&D, while Pfizer, Merck and Cisco have spent substantially more on R&D
than on buybacks.
What’s the right way to analyse US share buybacks? I don’t think there is one right way. Ben Hunt has done great investigative work looking at a couple of the large corporate share buybacks. Ed Yardeni has done the same looking at the whole S&P 500 index. I have taken the middle road by looking at the 20 or so largest share buybacks. Probably each one of these three approaches is prone to some selection bias geared to the conclusions one may want to reach!?
From being a niche discussion and research topic when I first started looking at it in 2015 to being now in the popular media on a daily basis, share buybacks do deserve this attention because they could be potentially affecting things like income and wealth inequality, corporate investment, employment, productivity, economic growth, etc. So, it is only good if more and more people look at the the numbers to try to figure what exactly is going on.
In the long run – yes (assuming no failed states).
Do you, guys, remember the Betteridge’s law of headlines?
How do we define a long run?
How about the whole history of the S&P 500 Index.
Since 1871 S&P 500 index has gone up 3,049% (2.4% annual return) or 1,855,212% (6.9% annual return) in real terms*.
However, it took 57 years for the S&P 500 to break firmly above its 1929 high in real terms! That’s more or less, one generation of flat returns.
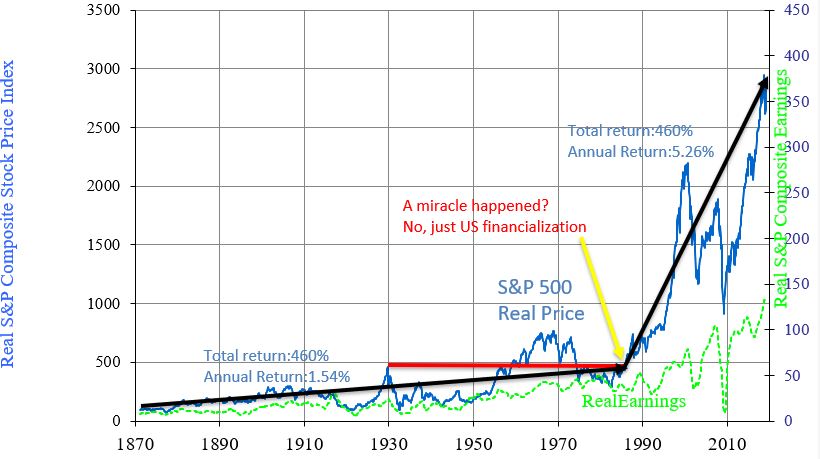
And let’s look at those 148 years of returns. How were they distributed?
For 115 of those, between 1871 and 1986, the S&P 500 had a total return
of about 460% (without dividends – just price change). That’s 1.5% return per
year.
Then for the next 33 years, the S&P 500 returned the same 460% in total but this time, the annual return was more than 3x higher at 5.3%.
115 years of return happened in just 33 years!
What exactly happened in the early 1980s?
Let’s just say, there was no miracle.
However, the power of shareholders’ primacy lead to an explosion of US share buybacks; the economy’s financialization lead to massive M&A activity and the reform of executive compensation incentives. All this contributed to the strong returns for US stocks.
There was, of course a positive correlation to US GDP growth and US
productivity growth and US population growth, but a negative correlation to the
changes in them (meaning, the lower growth rates of the US economy, productivity
and population in the latter period coincided with higher stock market
returns).
Were the strong returns post 1986 a payback of the decent returns prior or a pay-forward from the future earnings ahead?
My bet is on the latter given the possibility of simple mean reversion of returns probability coupled with lower real GDP growth rates and declining productivity growth rates. If negative returns on sovereign debt are any guidance, I would not be surprised if what follows is several decades of flat returns overall.
‘Banning’ buybacks won’t help, say the experts! Of course, it would, but you have to do it within the context of reversing shareholder profit maximization.
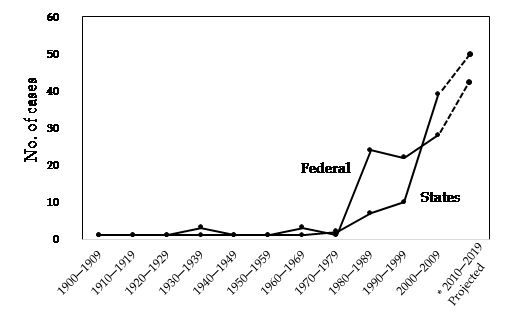
The SEC Rule 10b-18, which provided a ‘safe haven’ for share buybacks (they were never actually illegal), came into being in 1982. But the fertile ground of financialization and shareholder primacy thinking was already laid down in 1979. The theoretical ideas actually started fermenting even before, in 1932, with A. Berle’s and G. Means’ “The Modern Corporation and Private Property”, and culminated with “The Friedman doctrine” in 1970.
There is a huge misunderstanding about share buybacks before and after SEC Rule 10b-18. Buybacks were not ‘illegal’ before 1982, but the courts would generally be harsher on the interpretation of why they were conducted. Therefore, few companies attempted them. And it had all to do with the thinking behind ‘what is the purpose of a corporation’. For example, in the period 1900-1979, “courts were virtually silent on the idea of profit maximization”*. However, starting in the mid-1980s, this changed dramatically.
What followed was a spur of financialization, share buybacks and frantic M&A activity, all in line with finding innovative ways to reward shareholders. This resulted in a drastic decline in publicly traded US companies and the ‘oligopolization’ of US economy. Something which was undeniably good for shareholders became also questionably not so good for the economy and for everyone else, who is not a shareholder. In fact, the percentage of Americans who own shares in publicly traded companies has also declined in the process.
Shareholders primacy is often described as a ‘doctrine’, i.e. a mere belief system, when, in fact, it is much more than that. It is a “judge-made law” which means that “these varying levels of judicial embrace across many jurisdictions and over a long period have legal and jurisprudential significance.”*
This is important to understand. SEC Rule 10b-18 is not a law, but a rule within a complex maze of judicial proceedings and interpretations. Reversing that rule in isolation will do no good indeed as CEOs will find other way to return money to shareholders and they will be not only justified to do this by the corporate incentive system but also protected by the system of law. But reversing this rule in the context of questioning the point of shareholder profit maximization is a must.
And, just like in the early 1980s
when it was first introduced, the fertile ground of reversing it has already
been laid out a few years ago by the writings of people like William Lazonick, Lynn
Stout and a few others. Having put this issue on Washington’s agenda, we may be
indeed reaching an inflection point at next year’s presidential election.
*”A Legal Theory of Shareholder
Primacy”, Robert J. Rhee
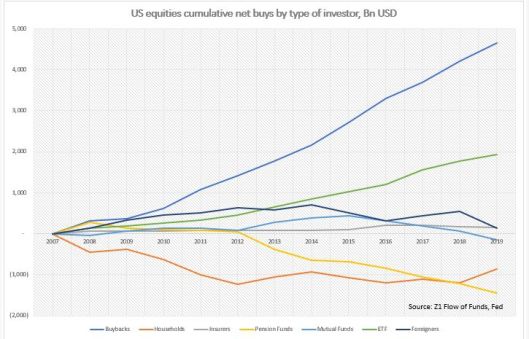
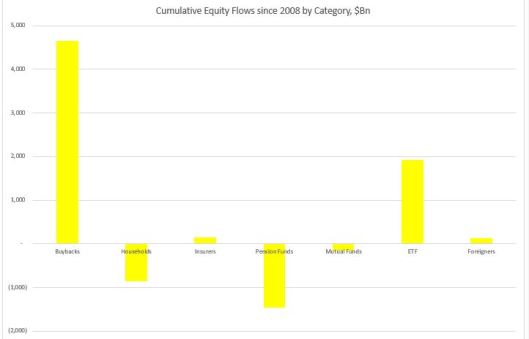
1.Net cumulative real money equity flow (households, mutual funds, pension funds, insurers and ETFs) is down almost $400Bn since 2008.
2.There is a clear trend obvious above of switching from active equity management (households, mutual funds, pension funds, insurers) to passive (ETFs).
3.The only real buyer of equities since 2008 are non financial corporates themselves. Although, to be fair, the domestic financial sector has been a large issuer of equities, especially immediately post 2008, offsetting some of the demand from corporates. Bottom line is that since 2008, very generally speaking, real money has been selling equities into a corporate bid.
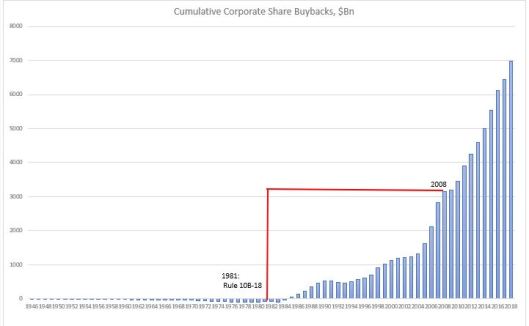
4.Share buybacks started in earnest only after SEC Rule 10B-18 was introduced in 1981. Until then corporates were net issuers of shares (supply increased). After 1983, on a cumulative basis, corporates became net buyers of equities (supply shrank). From 2008 onwards, corporates bought back more shares than for the whole period before.
5.Households have been reducing their direct holdings of equities. From 1946 till the early 1990s they moved from owning direct to owning equities through their pension fund. From 1990 till 2000 they expanded also in mutual funds and as a result, the growth of pension funds’ exposure to equities slowed down at the expense of mutual funds growth. And from 2000 till now they have been switching further into owning equities through ETFs at the expense of all of the above.
6.Since 2008, cumulative equity inflow from insurance companies and mutual funds is more or less flat. Pension funds divested from equities at the expense largely of ETFs.
7.Equities inflow from foreigners really picked up after 2000s but peaked in 2014.
Trade and tariffs, important as they are indeed for economic activity globally, are a sideshow when it comes to the big picture in the stock market. Yes, commodity markets may ebb and flow on trade but this is not the mercantile 19th or early 20th century. Look at the divergence between the oil majors and the price of oil this year, for example.
The big secular trends in stocks are determined by technological innovation and regulations. Their momentum is determined by net share buybacks (IPO minus share buybacks). Valuations play such a minor role that the cynic in me would probably say that they are used by clever stock analysts to give us reasons to buy their research.
We may be approaching such a turning point in US markets where the confluence of technology and regulations start to hurt stocks: 1) US is falling behind China in 5G, which is possibly the most important technological development at the moment; 2) US regulators are intent on drastically changing the business model of US tech company behemoths.
And stock market momentum may eventually be turning as well, if current trends of increased IPO supply and policy towards curbing share buybacks continue.
I am not talking about a one-off stock market correction, the way we’ve had so far since the 1980s. I am not even talking about a bear market. If these trends play out the way I described, the result will be much more structural: I expect at best the US stock market to deliver half of the total average annual return it has had so far since the 1980s, and at worst, to have a prolonged multi-decade sideways trajectory, similar to what it went through in the three decades prior.
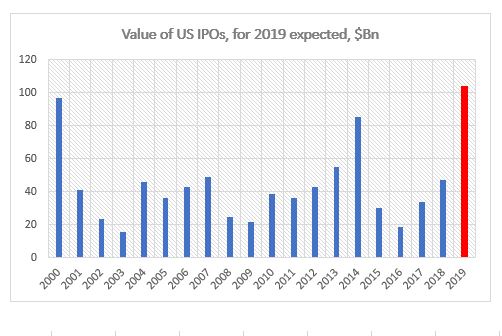
I don’t think
the stock market bulls appreciate the wave of supply that may hit the market in
2019. I know we got used to billions of dollars of share buybacks on the demand
side while not paying that much attention to the supply side. Yet, IPOs in the
last few years have been quietly building up. In fact, if the experts are
right, 2019 could beat the IPO record issuance reached before the dotcom bust.
According
to Renaissance Capital, the total value of private companies that are planning
to go public in 2019 is $697Bn. They estimate that if just 15% of that value exits
at IPO, that would amount to over $100Bn which would be more than the record
for IPOs set in 2000.
If companies manage to get their valuations just from tech names, there is a minimum of $200bn of value in the pipeline (Lyft, Uber, AirBnb, Pinterest, Slack, Postmates). Using the 15% benchmark, see above, that would make tech IPO size in 2019 somewhat similar to 2018 when the tech sector raised $32Bn in IPOs. But the $200Bn amount is on the conservative side. That would still make the tech sector the largest one in terms of IPO issuance.
How will that play out? Will there be enough demand to offset this
supply? With fewer individual retail accounts and fewer active managers than in
2000, how would passive investors react to this?
On top of
that, we have the threat of more regulation, especially on the tech sector, but
also on the general market with the spectre of a ban
on share buybacks looming on the horizon.
Just looking at the supply – demand dynamics, it feels like we do not even need to bother with the ‘subjective fact’ of excessively high valuations and recent earnings downgrades to make a good bear case for US stocks. But I can already foresee what the bulls would say, “If you discount the data by market cap, the extreme IPO number does not look that bad”. I guess, the jury on this is still out.
There are
two things we can say for sure about share buybacks:
1) based purely
on equity flows, they have dominated equity markets since at least 2000
2) based purely
on the reduction of share count, and assuming no increase in leverage, as is
indeed the case for most of the largest share buybacks, they push up the price
of shares
The verdict is out on whether they contribute to lower capital spending, and indirectly cause stagnant employment and wages. Given the supremacy of the shareholder primacy doctrine, I would be surprised if the latter does not hold (that is the whole point, in fact, even though, if every company targets lower employment costs, the cumulative effect on the economy would be lower aggregate demand, thus indirectly lower long-term company profitability), while it would be irresponsible if the former does, given that this ultimately cuts long-term profitability prospects.
Given the
record amount of investor equity outflows, the record amount of company share
buybacks and the near vertical rally in US equities since the beginning of the
year, we can finally put to rest the hypothesis that it is share buybacks that
drive primarily equity performance. This is indeed the conclusion that
sell-side analysts have come to recently (see Citi, JPM, GS), based on equity
flows, notwithstanding that when I was at HSBC, we came to the same conclusion
three years ago. It stands to reason then that as S&P companies enter their
blackout period en-masse starting next week and going into the middle of April,
we should expect equities to lose some ground.
Things are a bit more nuanced though. The biggest mistake people make when analysing buybacks is that they look at the whole market and use averages. You want to understand the effect of buybacks, look at the companies doing the buybacks.
Only 13% of publicly listed companies engage in share buybacks.
Of those, the largest 20 companies constitute more than 50% of all buybacks.
Of those Apple alone constitutes about ¼ of the total amount bought back.
The high concentration of buybacks among very few of the largest US companies guarantees their outsize effect on US equity indices performance while at the same time plays down their effect on equity fundamentals when looking at indices averages.
One unifying feature of the companies doing share buybacks is that their share count ends up substantially reduced. This is in stark contrast to the general market where share count is more or less flat to slightly down over the last 20 years or so. Over the last 5 years, the combined share count of the 20 largest share-buyback companies decreased by 11%. But there are wide variances amongst them. The biggest buybacks naturally reduce the most the share count. For example, Apple’s share count decreased by 23% and Boeing’s (5th largest) decreased by 24%.
There are two exceptions. Broadcom authorized $12Bn in buybacks in 2018 but over the last 5 years its share count has actually risen by 71%. And Micron Technology had a $10Bn buyback programme in 2018 but its share count has increased by 16% over the last 5 years.
Another unifying feature of the companies doing share buybacks is that their share prices tend to rise over time. The causation is a lot more difficult to prove given that over the last 5 years the general stock market is also up. But still, the average share rise of those 20 companies is almost double the rise in the S&P Index over that period.
And again, there
are two exceptions. Qualcomm share price has decreased by 28% over the last 5
years despite its share count down by 17%. And ConocoPhillips lost 4% of its
value while its share count went down by 5% over the period.
Do share buybacks ‘cook’ the books. Difficult to say using averages even on those 20 companies. Indeed, of those 20, on average top line growth is smaller than bottom line growth but is this from reduced share count or as a result of expanding profit margins due to cost cutting, for example? One has to dig deeper into the numbers on individual basis. Apple’s and Cisco’s Revenue growth is about half its EPS growth; Intel’s, Texas Instruments’, Amgen’s equivalent is between 3x and 5x smaller; yet Qualcomm’s, United Health’s and Wells Fargo’s Revenue is about 1.5x bigger than its EPS growth rate. And still others, like PepsiCo, Pfizer and Nike, have a negative Revenue growth rate but a positive EPS one. Finally, both ConocoPhillips and Merck have negative growth rate for both top-and bottom-line numbers.
Do share buybacks happen at the expense of capital investment? Again, difficult to judge even from these 20 companies without digging into debt, FCF etc. or other specifics. On average, capital spending growth over the last 5 years is in line with Revenue growth and below EPS. But there are, of course, outliers. Qualcomm, 3M, Adobe and Cisco have a negative capital spending growth rate despite positive Revenue and ESP growth rates. Oracle and Texas Instruments have double digit capital spending growth rates despite small single digit Revenue growth rates.
A few prominent people in the markets have written in support of buybacks and playing down their role in analysing US equity performance, but having looked at the numbers again from the bottom up, I cannot help but disagree with their conclusion.
Has
Boeing invested enough in R&D? Could investing more instead of returning
money to shareholders in the form of share buybacks and dividends have
prevented the faulty automated system which supposedly was the cause of the two
most recent fatal crashes?
Boeing’s share price has risen more than 250% over the last 5 years. The DJI, of which Boeing is a part of, has risen about 60%; the S&P Index has risen about 50% during that period.
Boeing has bought back a total of $39Bn of shares over the last 5 years which is actually just about half of the authorized amount. The 2018 share buyback payout ratio was about 76%. The share buyback has increased by 50% over this period, and at the moment it is one of the largest among US companies.
As a result of the share buybacks, Boeing’s share count has been reduced from 767m in 2013 to 586m in 2018, or by about 24%.
Over the same period Boeing has spent about $17Bn on R&D, about half the amount spent on buybacks; R&D spending has been flat in the last 5 years.
Top-line revenue growth over the last 5 years is about 3% per annum which fades in comparison to share price growth, or EPS growth (see below).
Bottom-line EPS annual growth rate, on the other hand, is about 24%. There is no doubt that this is a consequence of decreased share count (see above) simply by logical deduction. However, it could also be as a result of reduced costs (of which employment still is the largest, see below). Either way, both causes can be seen as a temporary phenomenon and not good for the company’s long-term prospects.
Boeing has reduced payroll by about 10% over the last 5 years, despite total US full-time employment rising by 10% over the same period.
Boeing has increased its dividend by 325% over the last six years. For 2018, its dividend payout ratio was 39%, which makes the total payout ratio stand at 115%, i.e. Boeing is spending more than 100% of its earnings on shareholders payouts. This is financed pretty much all by rising FCF rather than new debt.
Nothing wrong with giving some FCF back to investors IF: 1) that does not jeopardize the company’s future profitability, which would be determined more by top-line rather than bottom-line growth – there is a limit how much costs can be cut; 2) that means, unintentionally, producing a defective product which not only cuts company’s profitability or causes, in extreme cases, actual physical damage to consumers. In both cases, the verdict on Boeing is still out.
To all the people who think share buybacks are the best way
to utilize company’s resources, that they do not affect the company’s share
price, that they do not reduce the share count and have no bearing on
employment, Boeing is not your best example.