• About
  • BeyondOverton Travel
    • Silk Road (1): If Turkey is in crisis, it’s not obvious visiting it
    • Silk Road (2): Could beautiful nature and ancient history create a false sense of entitlement?
    • Silk Road (3): Fast Car
    • Silk Road (4):We took a bus ride to Iran
    • Silk Road (5): Border bothers
    • Silk Road (6): Chevrolet Land
    • Silk Road (7): Free-roaming camels and wild horses
    • Silk Road (8): China West to East
    • Silk Road (9): I have not told half of what I saw
  • BLOG
  • g88kboy Travel
    • On the Silk Road
    • Bulgaria : The Chicken crossed the Road
    • Turkey : The Country, not the Bird
    • Georgia on my Mind
    • Armenian Ayran
    • Iran – The Curious Land
    • An American in Azerbaijan
    • Uzbekistan: Golden Teeth and Neon Signs
    • Kazakhstan: Thirty Sweating Seniors
    • China Part One – Pandas Are Extinct
    • China Part Two: My TED Talk (Deep Analysis)
    • Phillipines – They Relax, I (pretend to😉) Study
    • Singapore: flashing trees and a torrent of tears
    • Malaysia: That ain’t no croc, it’s a log
    • Brunei: The Instinctive Fight for Superior Domination
    • Phillipines: Hello Friend Again
  • Outside the window
    • Bulgaria
    • Turkey
    • Georgia
    • Armenia
    • Iran
    • Azerbaijan
    • Uzbekistan
    • Kazakhstan

BeyondOverton

~ let's move this window

BeyondOverton

Category Archives: Equity

Share buybacks must be seen through the shareholder primacy doctrine

12 Sunday Aug 2018

Posted by beyondoverton in Equity, Politics

≈ Leave a comment

Tags

share buybacks


  • Buybacks are a direct and natural response to the shift in corporate management structure in the late 1970s which ushered in the period of ‘shareholder primacy’. It was Rule 10B-18 in 1982 which legitimized them.
  • Banning share buybacks without also changing the focus away from maximizing shareholder value will accomplish little because companies will simply find other ways to reach that objective.
  • The 1970s were a tumultuous period for the global economy with the two oil crises leading to stagflation and to enormous pressure on corporate profits. But the ground was set already in 1970 when M. Friedman published “The Social Responsibility of Business is to Increase Profits”.
  • In 1976 M. Jensen & W. Meckling published “Theory of the Firm: Managerial Behavior, Agency Costs and Ownership Structure” which explored the idea of equity-based compensation for professional managers.
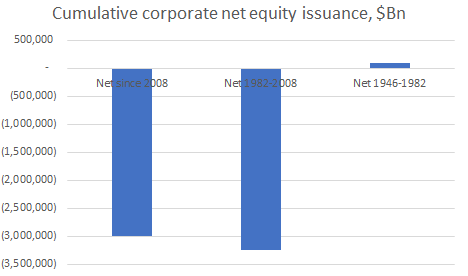
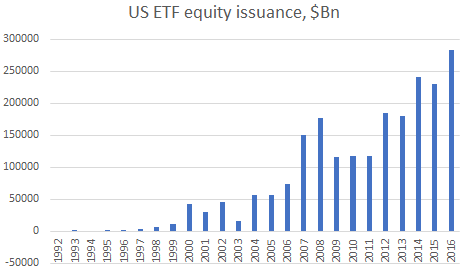
  • Finally, six years later Rule 10B-18 provided safe haven for companies to buyback their shares, allowing them another option to reward shareholders, in addition to dividends. The results were explosive.
  • Equity-based compensation rose from 0% of the median executive’s pay in 1980s to at least 60% in the 2000s; just in 1983, the aggregate amount of cash spent on share buybacks tripled and by 1985 it was 5 times higher than the average in the period 1972-1982.
  • With the incentive structure thus created in the 1980s, companies NOT doing buybacks would not be fulfilling their objective of maximizing shareholder value, notwithstanding that managers are also large shareholders.
  • Thus, banning buybacks makes no sense as it goes against the shareholder primacy doctrine unless, of course there is solid evidence that buybacks erode long-term shareholder value. So, therefore, the issue is not with buybacks but with the corporate management structure which has emerged since the 1980s.
  • Profit maximization and focus on shareholders has created extremely efficient companies boosting aggregate supply(AS), in many cases at the expense of aggregate demand(AD) at home, thus forcing those same companies to shift sales increasingly abroad.
  • It has also contributed to the concentration of both companies and shareholders, the former leading to the monopolization of US industries, the latter to US inequality->continuing with the shareholder primacy thus could indeed be damaging to corporate profits long terms once AD dries off even in EM.
  • I think it is difficult if not impossible to gauge the size of the effect of share buybacks on stocks prices or EPS, but there is no doubt that there is one: JPM, for ex. thinks effect on EPS growth is less than 10%, UBS thinks it is more than 30%.
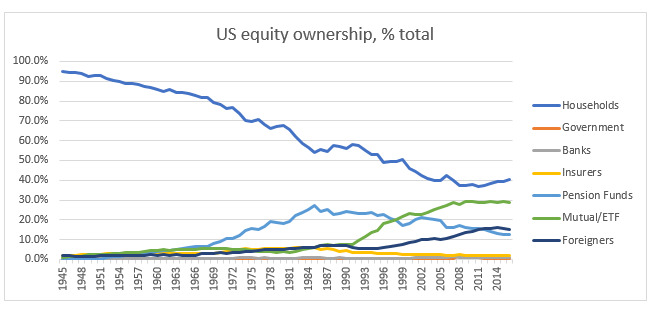
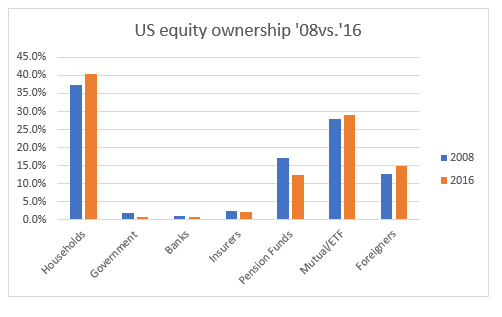
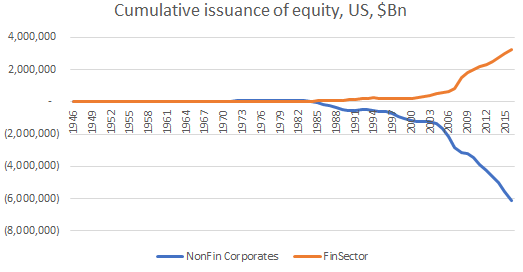
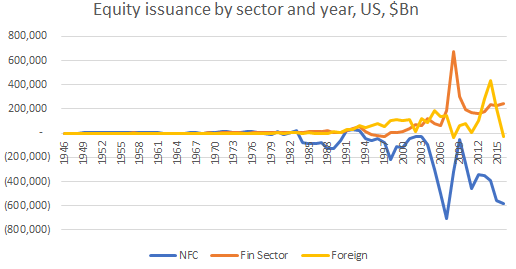
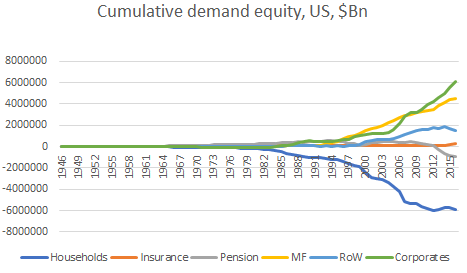
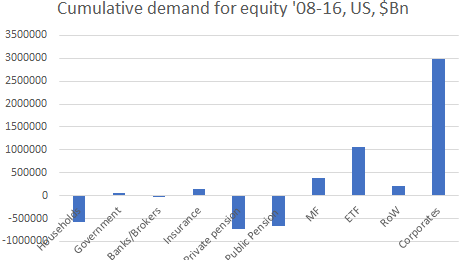
  • Fed’s Z1 Flow of Funds reports a break-down of the major equity buyers each quarter: since 2008 corporates buying back their shares is absolutely dominant; the second biggest ‘buyer’, ETF, is three times smaller; pension funds and households net sold equities during that period.
  • The stock price of profitable companies like Apple should be rising on its own merit , but that does not negate the possibility that buybacks ‘juice up’ stock prices even higher than ‘justified’. It goes the other way too: with 22 consecutive quarters of declining revenues the stock price of IBM probably should  be lower -where would IBM stock price be if not for buybacks?
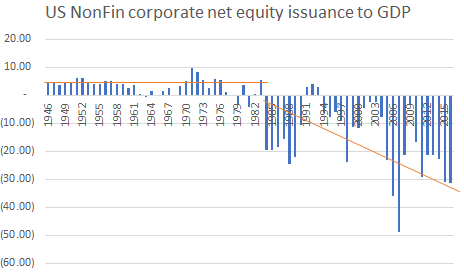
  • If we are adjusting R&D to GDP, we might as well adjust share repurchases to GDP as well (and yes, they are also at record high). Tech companies raising their R&D – that’s great – but if they did not do any buybacks, could they have raised it even more?
  • The recapitalization argument (shifting from equity to debt refinancing) is probably the most logical argument in favor of buybacks, if it was not for the agency conflict of interest (managers are equity holders) and the fact that they could have also boosted dividends instead.
  • The argument that giving money back to shareholders could boost wages and investment somewhere else (therefore, where is the problem?) – yes, it could – but as far as I am aware there is not much evidence of this.

Being long US equities does not ‘pay’ any more

15 Monday Jan 2018

Posted by beyondoverton in Equity

≈ Leave a comment

For the first time since 2009, the market gets ‘paid’ to be short US equites. With the S&P 500 Forward Futures curve moving from backwardation to contango, equity shorts start to earn positive carry. This may not mean an automatic reversal of the strong positive equity trend in US equities but it does remove one of the fundamental pillars of CTAs, momentum-driven and some algos in executing long S&P 500 Futures strategies.  

1.       Trend followers will tell you that the most powerful combination is when you are paid to be in the momentum. i.e. when you are not only riding the momentum but you are also getting paid to do that (you are earning positive carry).

2.       This is exactly what has happened in US equities since 2009: if you have been long US stocks through US index futures, this has been a positive carry trade in addition to being also a very powerful long-term momentum trend.

3.       This is actually quite unusual: the dividend yield was lower than the 3m TBill rate between the late-1950s till 2008 and long stocks through futures (early 1980s) had been a negative carry trade. In fact, the negative carry was around 2.5% pa during that period.

4.       Since 2008, however, the opposite has happened: with the dividend yield climbing above the 3m TBill rate, the carry of being long stocks through futures has flipped to an average of around +2% providing massive support to the stock market positive trend.

5.       (When the dividend yield is lower than 3m TBill rate, the SPX futures curve is in contango, and is in backwardation in the alternative scenario).

6.       Since last year, though, things have changed: with the Fed rising rates and the 3m Tbill yield moving up, the SPX futures curve first flattened out about 6 months ago and is now in contango.

7.       With the Fed continuing to raise rates, the SPX futures forward curve is likely to continue to steepen (3mTBill 1y fwd went above SPX dividend yield last December) and thus the negative carry of long equities through futures will also start increasing.

8.       Timing the market is a sucker’s game. People have been calling the end of the equity bull market the moment SPX reached the previous 2007 peak again in 2013. They have thrown everything at this call: valuations, flows, sentiment…

9.       I have no idea if 2018 will be the year when this trend will break but being long equities has lost an important pillar of support: the carry. All of a sudden, for the first time since 2009, the market is ‘paid’ to be short SPX futures!

US corporate profits and the S&P Index

10 Tuesday Oct 2017

Posted by beyondoverton in Equity

≈ Leave a comment

One would think that US corporate profits and the S&P Index should move closely together. And they do… most of the time. But when they diverge, should we be buying/selling US equities?

1990-2017

The chart above shows that since the 1990s there have been three such divergences where the S&P Index ‘outperforms’ US corporate profits by a large margin followed by a subsequent crash in equities: Dotcom Crash, the 2008 GFC, and whatever we have now (WWHN). The Dotcom crash was indeed an equity bubble with US equities starting to diverge already in the mid-1990s.

The 2008 GFC crash did not have much to do (if anything )with equities. However, US corporate profits started declining already in Q3 2006 while the S&P Index continued to rise well until the summer of 2008. Nevertheless, the divergence between the two was not that stark as the in DotCom crash. Still, the declines in the S&P Index during the Dotcom and 2008 GFC were similar.

The bounce back in US corporate profits after 2008 GFC was rapid and extreme, just like the decline was. This was again in stark contrast to the Dotcom crash which was preceded by flat US corporate profits since the mid-1990s. Their rise post the Dotcom crash, thus, was gradual. The 2008 GFC was such an extreme event that caused US corporate profits to ‘outperform’ the S&P Index between 2008 and 2013, a very rare event indeed (see Chart below).  

However, since Q1 2012, US corporate profits are more or less unchanged while the S&P Index continues to power higher. Still the divergence between the two now does not seem that extreme as in the Dotcom crash.

1947-1990

The only other time when US corporates ‘outperformed’ the S&P Index was between the mid-1970s and the mid-1980s. After being flat for almost 10 years priors, the rise in US equities after 1983 to ‘catch up’ with US corporate profits was extreme which might have contributed to the sudden crash in 1987. But one could think of that event as just a sudden stop to regain one’s breath after running a 100m sprint. The S&L crisis that followed, similar to the 2008 GFC, had almost nothing to do with equity valuations which, this time, was reflected in the performance of the S&P Index (no crash).

So where do we go from here?

Another way to look at the relative performance of US corporate profits and US equities is to index them to 1947 when data for US corporates started to be available (Chart below). What is obvious here is that ‘something’ happened in the early 1980s: The Great Financialization of the US economy started. Moreover, US equities got an extra ‘artificial’ push when the SEC introduced Rule 10B-18 which gave safe harbor for US companies to buy back their own shares.

The DotCom crash, 2008 GFC and WWHN (TBC) are much more visible and it seems that the divergence between the S&P Index and US corporate profits now is at least comparable to the Dotcom era. So, when is the ‘crash’? All this tells us, is that US equities are running ahead of US corporate profits and that they are on the expensive side when using traditional valuation methods. But there are other things that one should consider before making any conclusions about potential setback in share prices. And even when all things are lined up for that crash that everyone has been waiting for now years, there is still the trigger – leverage.

Why US equities keep outperforming?

07 Saturday Oct 2017

Posted by beyondoverton in Equity, Questions

≈ 1 Comment

A lot has been written lately about the outperformance of US stocks over European stocks. Here is a good summary.

I would add two other things to the list of possible reasons for this outperformance.

Corporate share buybacks

US corporate stock buybacks are a feature in US equities to a much larger extent than European corporate stock buybacks. For example, US corporates were given a “green light” to buy their own shares when Rule 10b-18 was introduced in 1982. The S&P Index started outperforming the DAX in the mid-1980s (Chart below, both of them indexed to 100 in 1959).

Source: Bloomberg, author’s calculations

As US buybacks increased, the outperformance became more obvious (Chart below).

Source: Bloomberg, author’s calculations

Intangible assets

A second reason for the outperformance of US stocks could be the higher % of intangible assets in US indices (Charts below).

Source: “Intangible Asset Market Value Study” by Cate M. Elsen and Nick Hill

Historically, the combined value of a company’s physical assets should equal its market value. But we know that this Tobin’s Q ratio has become a bad predictor of the stock market. Why? Because intangibles have replaced physical assets as the main factor of production. We cannot see the intangibles on companies’ balance sheets but there are ways to guess their worth (look at investments/expenditures on the income statement). According to Simcha Barkai from the University of Chicago, intangibles are worth $48Tn just in the US (that’s more than the physical value of all companies’ assets)!

Who owns US equities?

18 Monday Sep 2017

Posted by beyondoverton in Equity, Questions

≈ 1 Comment

Source: US Z1 Flow of Funds, Federal Reserve

  • The ownership of US equities has changed significantly since WW2. In 1945, US households owned 95% of all US equities directly. By 2016 that figure had gone down to just 40%. However, households are still the largest owners of US equities direct.
  • Between 1945 and 1985, households switched from directly owning some of their equities to owning equities through pension funds. While in 1945, pension funds had pretty much 0% holding of equities, by 1985 that number had gone up to 27%. Thereafter, pension fund holdings of equities has declined to 15%. In 2016, pension funds are only the 4th largest owner of US equities.
  • After the mid 1980s, with the financialization of the US economy in full bloom, households started investing in mutual funds and closed end funds, and later on ETFs. Mutual funds/ETF holdings of equities rose from just 6% in 1985 to 29% now, and they form the second largest holder of US equities. The share of ETFs rose especially rapidly after 2000.
  • Foreigners’ holdings of US equities also substantially increased after the early 2000s with the process of globalization taking speed and especially so after China entered WTO. As a % of total, foreign ownership of US equities doubled from 7.5% in 1999 to 15% now. Even though foreigners have been net sellers of US equities in the last couple of years, they still represent the 3rd largest holder.
  • The US government has been a holder of US equities since 1996 mostly through state and local governments. In 2008 the federal government acquired some equities as part of the bailout program after the 2008 financial crisis. The Fed also bought equities in 2009 and 2010. Both the federal government and the Fed have been selling equities since then.
  • Banks and insurance companies are the other holders of US equities but their holdings are either small and steady (banks at around 1%) or small and declining (insurance companies’ holdings have declined from 6% in the early 1980s to 2% now).
  • The chart below shows how US equity ownership as a % of total has changed between 2008 and 2016.

Source: US Z1 Flow of Funds, Federal Reserve


The turn in the equity bull market could possibly only come if Rule 10B-18 is revoked…

13 Wednesday Sep 2017

Posted by beyondoverton in Equity

≈ 2 Comments

…followed by a de-financialization of the US economy.

I am not talking about a correction in this bull market, whether a one-off (1987, for example) or a cyclical one caused by a financial/economic crisis (1998, 2000, 2008). This can happen any time leverage is too high. I am also not talking about a structural bear market either, like the one we had after the Great Depression between 1930 and 1950, for example. For that to happen, if ever (given that it did not happen after the Great Financial Crisis of 2008 thanks to the authorities’ help in restoring the financial plumbing of the economy), we need much more than a regulatory change: we need an economic and financial crisis coupled with a failure of trust in our institutional infrastructure.  What I am talking about is a sustained structural change in the dynamics of the market, something more reminiscent of the more “sideways” market between 1960-1980. The latter can happen without any economic and financial reason; it can happen just if the SEC revokes Rule 10B-18 which allows US corporates ‘safe haven’ to buy their own shares.

The SEC introduced Rule 10B-18 in 1982. The rule greatly simplified the procedures which US corporates must follow in order to buy back their own shares. This resulted in a big spike in US corporate share buybacks. For example, before 1982, there was very little US corporate buyback activity for fear of insider trading prosecution and the likes. Since the rule came into force and especially since the financialization of the US economy in the 1980-90s which spurred M&A and hostile takeovers, and the change in management incentives towards more equity-based remunerative structure, US corporates have become the dominant buyer of US equities. They are a fundamental structural force, and one that is greatly underappreciated, in the equity bull market that followed.

The chart at the top of this post illustrates the financialization of the US economy that took place in the early 1980s and it is ongoing now. Non-financial corporations have been net buying back their own shares (negative equity issuance) while financial corporations have been issuing new shares.

Supply of US equities

Overall US equity issuance can be broken down among three sectors: financial, non-financial and foreign (ADRs, for example). Though the financial and foreign sector have been generally net issuing shares throughout the history of the data, there is a break in the pattern of equity issuance for the non-financial corporate sector (chart below). While between 1945-1982 the latter has been a net supplier of equities, after, it has been a net buyer of equities (negative net equity issuance).

We can see that more clearly if we factor US corporate net equity issuance by GDP (chart below). While before 1982 there were only five years when there was a negative equity corporate issuance, after 1982 the opposite happened: there were only three years when US corporate issued more new shares than they bought outstanding ones.

Or another way to look at the changes which occurred in the early 1980s is to break up the periods (chart below). The positive net supply of corporate equities between 1945-1982 dwarfs the negative corporate issuance thereafter. I have broken the 1982-2016 period into two. For the 8 years between 2008 and 2016 US corporates bought (negative net issuance) as much of their own shares as for the 26 years which preceded (1982-2008): this is the power of corporate share buying since the 2008 financial crisis!

The financial sector, however, has been a net supplier of equities. This is not because banks and other financial institutions have been issuing equities (even though they have as part of their financial restructuring after 2008) but because of ETF shares supply. The two charts below show the breakdown of total US equity supply by the three main categories and the rise of the ETF respectively.

That’s how the supply side of US equity looks. What about the demand side?

Demand for US equities

The chart below shows a breakdown of the cumulative demand form the main traditional buyers of equities. Households have been the largest seller of equities. However, what they have done is basically sold their direct holdings of equities but bought equities through mutual funds (and ETFs –  included in that number) and pension funds. Nevertheless, even taking this indirect ownership of equities, US households have net divested of equity shares as pension funds (both public and private) have also net sold equities since 2013. The other big traditional buyer is foreigners but they have also recently started divesting of US equities.

So, how is it possible that the demand for equities from the traditional market players seems to be on a decline relative to history but we have had this amazing bull market in US equities since 2009? It is the supply. I have included in the chart above also US non-financial corporates buying of equities as a positive number (this is the same as negative net supply – the opposite of the line in the chart on top of the post). This is especially so after the 2008 financial crisis, when cumulative US corporate share buybacks overtook buying of US shares by foreigners. In fact, looking only at the 2008-2016 period, US corporate net share buybacks far outstrip any other equity demand (chart below).

Reality is that US corporates sit in both the demand side -through buybacks of outstanding shares – and the supply side – through IPOs – of US equities). They are in a unique position to affect both: the act of buying back your own shares affects positively demand for them but it also affects negatively their supply (the shares are retired and they do not come back to the market). This simultaneous increase in demand and decrease of supply makes US corporates the most important player in the US equity market. That is why, any change in their dominance position would have huge repercussions on the equity market trend.

Newer posts →

Subscribe

  • Entries (RSS)
  • Comments (RSS)

Archives

  • January 2023
  • December 2022
  • November 2022
  • August 2022
  • February 2022
  • April 2021
  • November 2020
  • October 2020
  • September 2020
  • August 2020
  • July 2020
  • June 2020
  • May 2020
  • April 2020
  • March 2020
  • February 2020
  • January 2020
  • December 2019
  • November 2019
  • October 2019
  • May 2019
  • March 2019
  • February 2019
  • January 2019
  • December 2018
  • November 2018
  • October 2018
  • September 2018
  • August 2018
  • June 2018
  • May 2018
  • March 2018
  • February 2018
  • January 2018
  • November 2017
  • October 2017
  • September 2017
  • August 2017
  • July 2017
  • June 2017

Categories

  • AI
  • Asset Allocation
  • blockchain
  • China
  • De-urbanization
  • Debt
  • Decentralization
  • EM
  • Energy
  • Equity
  • FX
  • g88kboy
  • Monetary Policy
  • Politics
  • Questions
  • Quotes
  • The last man standing will laugh
  • Travel
  • UBI
  • Uncategorized
  • VR

Meta

  • Create account
  • Log in

Blog at WordPress.com.

  • Subscribe Subscribed
    • BeyondOverton
    • Join 74 other subscribers
    • Already have a WordPress.com account? Log in now.
    • BeyondOverton
    • Subscribe Subscribed
    • Sign up
    • Log in
    • Report this content
    • View site in Reader
    • Manage subscriptions
    • Collapse this bar
 

Loading Comments...