
…followed by a de-financialization of the US economy.
I am not talking about a correction in this bull market, whether a one-off (1987, for example) or a cyclical one caused by a financial/economic crisis (1998, 2000, 2008). This can happen any time leverage is too high. I am also not talking about a structural bear market either, like the one we had after the Great Depression between 1930 and 1950, for example. For that to happen, if ever (given that it did not happen after the Great Financial Crisis of 2008 thanks to the authorities’ help in restoring the financial plumbing of the economy), we need much more than a regulatory change: we need an economic and financial crisis coupled with a failure of trust in our institutional infrastructure. What I am talking about is a sustained structural change in the dynamics of the market, something more reminiscent of the more “sideways” market between 1960-1980. The latter can happen without any economic and financial reason; it can happen just if the SEC revokes Rule 10B-18 which allows US corporates ‘safe haven’ to buy their own shares.
The SEC introduced Rule 10B-18 in 1982. The rule greatly simplified the procedures which US corporates must follow in order to buy back their own shares. This resulted in a big spike in US corporate share buybacks. For example, before 1982, there was very little US corporate buyback activity for fear of insider trading prosecution and the likes. Since the rule came into force and especially since the financialization of the US economy in the 1980-90s which spurred M&A and hostile takeovers, and the change in management incentives towards more equity-based remunerative structure, US corporates have become the dominant buyer of US equities. They are a fundamental structural force, and one that is greatly underappreciated, in the equity bull market that followed.
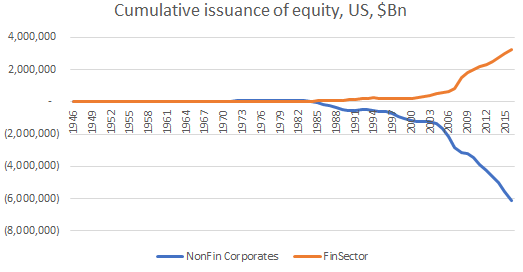
The chart at the top of this post illustrates the financialization of the US economy that took place in the early 1980s and it is ongoing now. Non-financial corporations have been net buying back their own shares (negative equity issuance) while financial corporations have been issuing new shares.
Supply of US equities
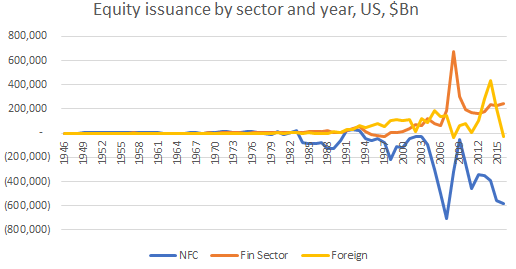
Overall US equity issuance can be broken down among three sectors: financial, non-financial and foreign (ADRs, for example). Though the financial and foreign sector have been generally net issuing shares throughout the history of the data, there is a break in the pattern of equity issuance for the non-financial corporate sector (chart below). While between 1945-1982 the latter has been a net supplier of equities, after, it has been a net buyer of equities (negative net equity issuance).
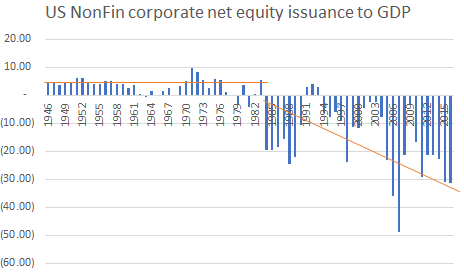
We can see that more clearly if we factor US corporate net equity issuance by GDP (chart below). While before 1982 there were only five years when there was a negative equity corporate issuance, after 1982 the opposite happened: there were only three years when US corporate issued more new shares than they bought outstanding ones.
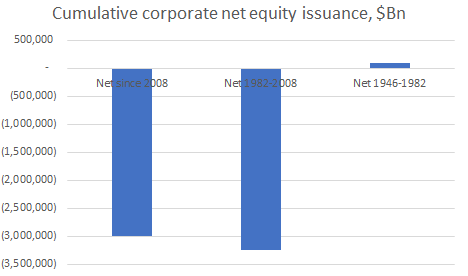
Or another way to look at the changes which occurred in the early 1980s is to break up the periods (chart below). The positive net supply of corporate equities between 1945-1982 dwarfs the negative corporate issuance thereafter. I have broken the 1982-2016 period into two. For the 8 years between 2008 and 2016 US corporates bought (negative net issuance) as much of their own shares as for the 26 years which preceded (1982-2008): this is the power of corporate share buying since the 2008 financial crisis!
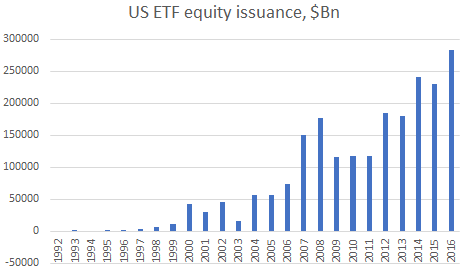
The financial sector, however, has been a net supplier of equities. This is not because banks and other financial institutions have been issuing equities (even though they have as part of their financial restructuring after 2008) but because of ETF shares supply. The two charts below show the breakdown of total US equity supply by the three main categories and the rise of the ETF respectively.

That’s how the supply side of US equity looks. What about the demand side?
Demand for US equities
The chart below shows a breakdown of the cumulative demand form the main traditional buyers of equities. Households have been the largest seller of equities. However, what they have done is basically sold their direct holdings of equities but bought equities through mutual funds (and ETFs – included in that number) and pension funds. Nevertheless, even taking this indirect ownership of equities, US households have net divested of equity shares as pension funds (both public and private) have also net sold equities since 2013. The other big traditional buyer is foreigners but they have also recently started divesting of US equities.
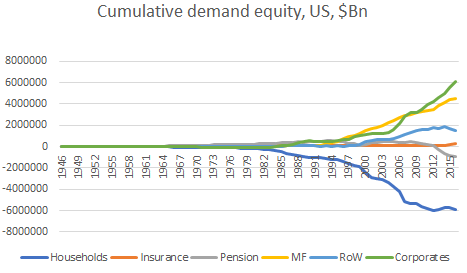
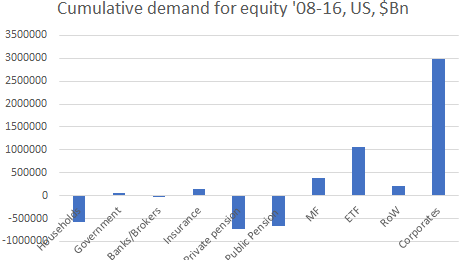
So, how is it possible that the demand for equities from the traditional market players seems to be on a decline relative to history but we have had this amazing bull market in US equities since 2009? It is the supply. I have included in the chart above also US non-financial corporates buying of equities as a positive number (this is the same as negative net supply – the opposite of the line in the chart on top of the post). This is especially so after the 2008 financial crisis, when cumulative US corporate share buybacks overtook buying of US shares by foreigners. In fact, looking only at the 2008-2016 period, US corporate net share buybacks far outstrip any other equity demand (chart below).
Reality is that US corporates sit in both the demand side -through buybacks of outstanding shares – and the supply side – through IPOs – of US equities). They are in a unique position to affect both: the act of buying back your own shares affects positively demand for them but it also affects negatively their supply (the shares are retired and they do not come back to the market). This simultaneous increase in demand and decrease of supply makes US corporates the most important player in the US equity market. That is why, any change in their dominance position would have huge repercussions on the equity market trend.

Pingback: Missing liquidity, good intentions and unintended consequences | BeyondOverton
Have you heard anything about this rule being revoked in August? I was sent a video about this from a guy named Banyan…basically a dooms day scenario.