

One would think that US corporate profits and the S&P Index should move closely together. And they do… most of the time. But when they diverge, should we be buying/selling US equities?
1990-2017
The chart above shows that since the 1990s there have been three such divergences where the S&P Index ‘outperforms’ US corporate profits by a large margin followed by a subsequent crash in equities: Dotcom Crash, the 2008 GFC, and whatever we have now (WWHN). The Dotcom crash was indeed an equity bubble with US equities starting to diverge already in the mid-1990s.
The 2008 GFC crash did not have much to do (if anything )with equities. However, US corporate profits started declining already in Q3 2006 while the S&P Index continued to rise well until the summer of 2008. Nevertheless, the divergence between the two was not that stark as the in DotCom crash. Still, the declines in the S&P Index during the Dotcom and 2008 GFC were similar.
The bounce back in US corporate profits after 2008 GFC was rapid and extreme, just like the decline was. This was again in stark contrast to the Dotcom crash which was preceded by flat US corporate profits since the mid-1990s. Their rise post the Dotcom crash, thus, was gradual. The 2008 GFC was such an extreme event that caused US corporate profits to ‘outperform’ the S&P Index between 2008 and 2013, a very rare event indeed (see Chart below).
However, since Q1 2012, US corporate profits are more or less unchanged while the S&P Index continues to power higher. Still the divergence between the two now does not seem that extreme as in the Dotcom crash.
1947-1990

The only other time when US corporates ‘outperformed’ the S&P Index was between the mid-1970s and the mid-1980s. After being flat for almost 10 years priors, the rise in US equities after 1983 to ‘catch up’ with US corporate profits was extreme which might have contributed to the sudden crash in 1987. But one could think of that event as just a sudden stop to regain one’s breath after running a 100m sprint. The S&L crisis that followed, similar to the 2008 GFC, had almost nothing to do with equity valuations which, this time, was reflected in the performance of the S&P Index (no crash).
So where do we go from here?
Another way to look at the relative performance of US corporate profits and US equities is to index them to 1947 when data for US corporates started to be available (Chart below). What is obvious here is that ‘something’ happened in the early 1980s: The Great Financialization of the US economy started. Moreover, US equities got an extra ‘artificial’ push when the SEC introduced Rule 10B-18 which gave safe harbor for US companies to buy back their own shares.
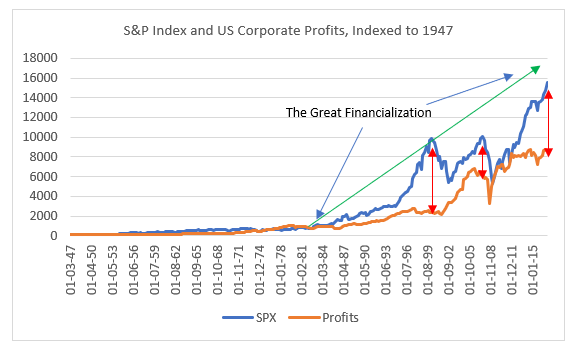
The DotCom crash, 2008 GFC and WWHN (TBC) are much more visible and it seems that the divergence between the S&P Index and US corporate profits now is at least comparable to the Dotcom era. So, when is the ‘crash’? All this tells us, is that US equities are running ahead of US corporate profits and that they are on the expensive side when using traditional valuation methods. But there are other things that one should consider before making any conclusions about potential setback in share prices. And even when all things are lined up for that crash that everyone has been waiting for now years, there is still the trigger – leverage.
