• About
  • BeyondOverton Travel
    • Silk Road (1): If Turkey is in crisis, it’s not obvious visiting it
    • Silk Road (2): Could beautiful nature and ancient history create a false sense of entitlement?
    • Silk Road (3): Fast Car
    • Silk Road (4):We took a bus ride to Iran
    • Silk Road (5): Border bothers
    • Silk Road (6): Chevrolet Land
    • Silk Road (7): Free-roaming camels and wild horses
    • Silk Road (8): China West to East
    • Silk Road (9): I have not told half of what I saw
  • BLOG
  • g88kboy Travel
    • On the Silk Road
    • Bulgaria : The Chicken crossed the Road
    • Turkey : The Country, not the Bird
    • Georgia on my Mind
    • Armenian Ayran
    • Iran – The Curious Land
    • An American in Azerbaijan
    • Uzbekistan: Golden Teeth and Neon Signs
    • Kazakhstan: Thirty Sweating Seniors
    • China Part One – Pandas Are Extinct
    • China Part Two: My TED Talk (Deep Analysis)
    • Phillipines – They Relax, I (pretend to😉) Study
    • Singapore: flashing trees and a torrent of tears
    • Malaysia: That ain’t no croc, it’s a log
    • Brunei: The Instinctive Fight for Superior Domination
    • Phillipines: Hello Friend Again
  • Outside the window
    • Bulgaria
    • Turkey
    • Georgia
    • Armenia
    • Iran
    • Azerbaijan
    • Uzbekistan
    • Kazakhstan

BeyondOverton

~ let's move this window

BeyondOverton

Category Archives: Equity

What explains the spectacular bounce in risk?

16 Wednesday Nov 2022

Posted by beyondoverton in Asset Allocation, China, Debt, Equity, Monetary Policy

≈ 1 Comment

The prevailing sentiment among the people I speak to (predominantly hedge fund managers) is to sell this rally. The reasons given are (also see below for a complete list): 1) One CPI is unlikely to change the Fed’s interest rate trajectory (basically we are data dependent), 2) China has not changed its zero-Covid strategy in earnest, 3) There is still a risk of a winter energy crisis in Europe, 4) JPY weakness will not reverse before YCC is over.

All these are valid, but I will stick with a risk-on attitude a bit longer. In any case, what caused this drastic change in sentiment?

Positioning was really lopsided. See this article citing research from GS which believes CTAs were forced to buy $150Bn in equities and $75Bn in bonds. Real money is also very light risk after being forced to reduce exposures throughout the year. But what were the main drivers which changed sentiment to begin with?


It was weird to see markets actually not really selling off after Powell’s hawkish FOMC press conference. Perhaps the fact that we had a bunch of FOMC members (see here and here, for example), calling for a slowing down of the pace of Fed Fund Rate (FFR) increases, may explain to some extent the positive reaction at the time. And of course, the catalyst came when the US CPI was released lower than expected.


FFR actually does not give anymore a precise indication of the stance of US monetary policy – this is the conclusion of a new paper by FRBSF. If all data such as forward guidance and central bank balances sheet effect are taken into account, the FFR is more likely already above 6% vs the current target of 3.75-4% (the paper puts the FFR at 5.25% for September and I add the 75 bps of hikes since then).

This means monetary policy today is even more restrictive than at the peak before the 2008 financial crisis and approaching levels last seen during the tech bust in 2000. The findings in the paper make intuitive sense. Quoting from the paper:

“[W]hen only one tool was being used before the 200s, the stance of monetary policy was directly related to the federal funds rate. However, the use of additional tools and increased policy transparency by FOMC participants has made it more complicated to measure the stance of policy.”

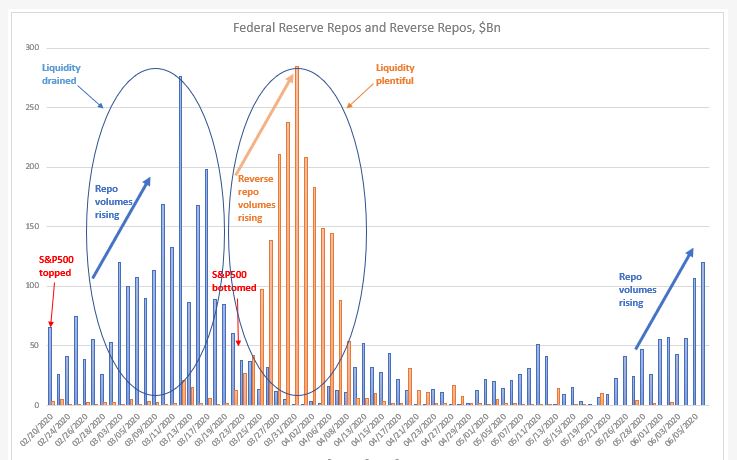
The new tools the authors refer to are mainly forward guidance, which started to be actively used after 2003, and central bank balance sheet management, which started after 2008. The proxy FFR (see chart above) actually includes a lot more, a total of 12 market variables, including UST yields, mortgage rates, borrowing spreads, etc. It is perhaps intuitively easier to see that monetary policy was much looser at times when the FFR was at the zero-low bound and QE was in full use than it is a lot tighter today when FFR is firmly in positive territory and QT is in order, but the logic is the same.


So, I think somehow or other, the market now believes that we have seen the peak in FFR (forward) – that provided the foundation of the risk bounce.

China provided the other pillar of support for risk. Ironically, in a similar fashion to how it played out after FOMC, i.e., the consensus was that the 20th CCP Politburo meeting was an overwhelming negative for Chinses assets. And even though they sold off, there was no immediate follow through. In fact, we started hearing that Chinese authorities are looking into taking the first steps to pivot from the Zero-Covid policy, and are very serious about providing a floor for property prices. Finally, there was a genuine improvement on the US-China relations side as US regulators finished their inspection of Chinese companies in HK ahead of schedule and US President Biden and Chinese leader Xi Jinping met at the Group of 20 summit in Bali.

The third pillar of support came from Europe. First, European energy prices (see a chart of TTF) have come a long way down from their peak in the summer (almost full inventories and mild weather helped). Second, the UK pension crisis was short-lived after the change in government and did not have any spill-over effects on other markets. And third, there is genuine hope of a negotiated solution of the war in Ukraine after the Ukrainian army made some sizable advances in reclaiming back lost territory, with both the US and Russia urging now for possible talks. My personal view is that the quick withdrawal of Russia from these territories is a deliberate act to incentivize Ukraine to come to the negotiating table – even though the latter does not seem eager too . Yesterday’s missile incident, and Ukraine’s quick claim that it is Russia’s fault, which is contrary to what preliminary investigation has led to so far, might be a testament to that.

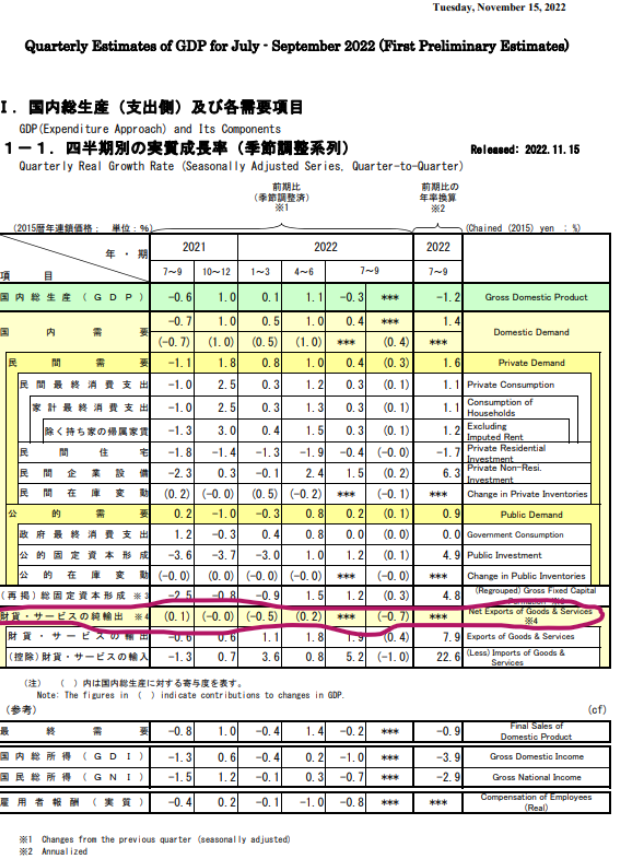
Finally, and that falls under positioning, there is the unwind of USDJPY longs spurred by heavy intervention by Japanese authorities. If there is any proof that policy makers are taking the plunge in the Yen seriously it is in the details of Japan’s Q3 GDP which shrunk unexpectedly by 1.2% (consensus was for a 1.2% increase). The bad news came almost entirely from the negative contribution of net trade. Net trade has been a drag on GDP for the last four quarters primarily from the rise in imports, i.e., the weakness in the Yen. The good news is that the economy otherwise is doing fine: private demand had a big bounce from the previous quarter and has been a net positive overall (all data can be found here): in other words, the problem is the Yen, and YCC makes that worse.

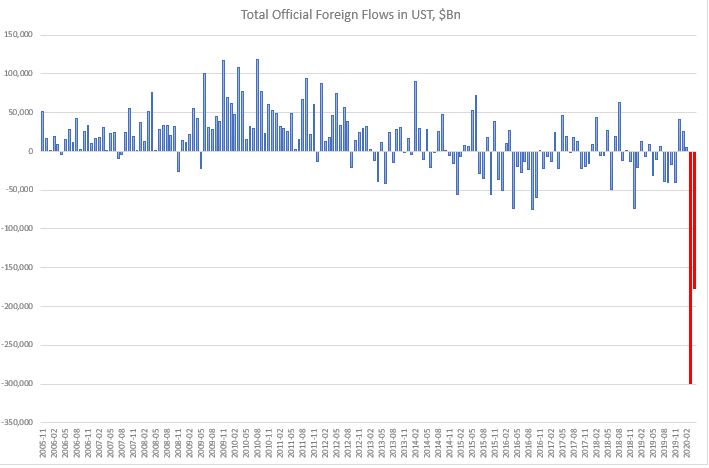
Another piece of data, released last week, which caught our attention, is Japan FX Reserves. The decline from the high in July 2020 is $241Bn, about 18% – that is a substantial amount. The interesting thing, and we kind of know this from the TIC data is that the decline is coming entirely from the sale of foreign securities; deposits actually went up marginally (some of the decline is also valuation). But we know now that when Japan was intervening in USDJPY in September/October, it was selling securities, not depos – most analysts thought Japan would first reduce depos, while intervening, before selling their security portfolio. All data is here.

In summary, CTAs’ sizable wrong way bets long USD and short equities and bonds and real money light risk exposure overall coincided with dovish economic data, reopening China and improving geopolitics (all of these happening on the margin).

The Apple of my eye

09 Wednesday Nov 2022

Posted by beyondoverton in China, Equity

≈ Leave a comment

Tags

tech shares

After a nearly two-year hiatus due to compliance requirements (I was consulting a hedge fund start-up), I will attempt to continue writing on this blog in a more frequent format until further notice.

The Apple of my eye

One of the most enduring questions I have encountered lately is, “How come Apple is still ‘standing’ when not only other big techs are falling apart but also given that Apple is one of the most heavily exposed, amongst them, on China?”. The best answer to this was given this week by Scott Galloway here.

At the core of Apple’s recent outperformance (the stock is down only 20% from peak vs 40-50% for the other big tech and even more for the smaller tech) is a decision the company made a year ago to the effect that the upgraded Apple iOS “forced apps, including Facebook… to ask users for permission to track their data”. Here is the story on this from October 22, 2021.  

As it turns out, only about 16% of users agree to such tracking which is a big problem for companies using sophisticated data to direct ads to potential customers. As Prof. Galloway succinctly says in his note, ”[W]ithout data, the digital ad ecosystem doesn’t work”.

Here is a chart of Meta’s global ad revenue growth rates YoY until 2021. Unfortunately, in Q3’22 the company reported its first ever annual decline on a quarterly basis in ad revenues ever. Needless to say, when ad revenues make up more than 95% of the total, this development is a big problem going forward.

What about Apple? The company’s share price performance is perhaps a better indication of the drawdown one would expect stemming from all macro forces for a leading monopoly-like big tech. Yet, its overreliance on revenues from Greater China and Europe (the two combined are bigger than revenues from Americas), two regions which are grappling with idiosyncratic issues such as zero-Covid and an energy-crisis, is probably a reason to be cautions on the stock, nevertheless.

Alibaba and the 40 risks

China tech (CQQQ) trades at a record ‘discount’ to US tech (QQQ): the underperformance of the former from a year ago is staggering.

This underperformance is primarily due to regulatory issues which first started in the beginning of 2021 in China. Then at the end of that same year, US regulators independently added further pressure on Chinese companies listed on US bourses. Some of the big China tech ADRs, like Alibaba, are not only trading below IPO price, but also are down 80% from their highs.

I have no idea where this is going to end. However, I do believe that there is legitimate progress in easing of the regulatory burden from both the Chinese side as well as the US one. In any case, given that Chinese ADR positioning is now much cleaner, the regulatory risk from the US side can be easily avoided if one buys the HK-listed shares.  I do not know if this is the right time to do that, but I do know that, given their extreme undervaluation, it makes little sense to sell Chinese tech stocks on the risk of a continuation of the zero-Covid policy.

On the other hand, a China pivot on this policy would provide a massive boost to their share prices. From such an angle, the risk-return profile favours some exposure to HK-listed China tech. Still, for any investor in China, the risk of an (almost) ‘total ruin’ is quite real in the extreme scenario of a China-Taiwan conflict which leads to the freezing of Chinese external assets as well as closing access for foreigners to China/HK-listed company shares – something akin to what happened in Russia.

Ultimately, it is this unquantifiable risk which probably holds foreign investors off from dipping their feet in the China market. But, as always, the risk to any trade is not in whether one has the exposure or not, but rather what size it is and how it is timed.

Chinese ADRs Delisting Risk

08 Tuesday Feb 2022

Posted by beyondoverton in China, Equity, Politics

≈ Leave a comment

After SEC finalized the rules relating to the Holding Foreign Companies Accountable Act (HFCA) in December last year, the next shoe to drop would be the Public Company Accounting Board (PCAOB) to identify which ADRs become ineligible for US listing. That latter would very much depend on which accounting firm does the ADR company audits – is there adequate disclosure primarily on foreign government ownership and the use of VIE structures. After that the companies have three years to comply with the rule (regulators may shorten that to 2 years). If the authorities are still not happy with the disclosures, the ADRs get delisted. So, the earliest delisting is 2024 at the moment.

This paper analyses case studies on Chinese companies that delisted from US exchanges in the past. There have been 80 such companies between 2001 and 2019 of which 29 are still operating, 26 are out of business, 14 relisted in HK/China, 11 were acquired. About Âź of those companies actually had a positive performance (IPO price minus stock delisting price). Moreover, companies that relist themselves on Chinese stock exchanges (including Hong Kong) or get acquired by private equities have already shown positive returns before delisting, on average.

In 2015 alone, 29 Chinese ADRs announced their decisions to delist and go private. A similar wave of Chinese ADRs announcing to delist and go private also occurred during the 2011-2014 period. This paper suggests that the wave of Chinese ADRs announcing to delist and go private in 2015 was mainly motivated by the Chinese government’s economic policies and regulatory changes. In that sense, it is different from the wave of going private during 2011-14, which was more likely motivated by undervaluation. It looks like the potential 2024 delisting would be caused by US regulators.

One option after delisting from US exchanges is an equivalent listing in HK. This is the default assumption of many foreign investors who have been switching to a HK listing already. But for those that don’t have a HK listing already, a listing on the A-share market either directly – an extremely cumbersome process as it would require the unwinding of the VIE structure, in most cases – or indirectly, via a CDR is a real possibility. CDRs are akin to ADRs and allow foreign-incorporated Chinese companies to list at home (the VIE structure remains intact – Ninebot a small scooter maker became the first such company to issue CDRs in September 2020). This could work well for Chinese internet ADRs which generally trade at a discount compared now to similar names in the A-share market.

Could forced delisting be averted? Possibly, if the US and China find a way to resolve their differences before the period of non-compliance is enforced. For example, in Europe, China was able to negotiate an arrangement known as “regulatory equivalence” whereby EU regulators accepted the auditing work done by the foreign accounting firm. This is extremely unlikely in the US given the current tensions between the two countries and the example of recent Chinese accounting irregularities (Luckin Coffee).

Another option is for Chinese companies listed in the US start to start complying with the necessary regulatory requirements. That is also extremely unlikely because it would require Chinese companies to hand over data and materials viewed as critical to national security by the Chinese government.

VIX: Back to the ’90s

03 Saturday Apr 2021

Posted by beyondoverton in Equity

≈ Leave a comment

Tags

vix

2020 was unusual in the markets in many respects, one of which was the number of times SPX hit ATH when the VIX was above 20. The first time the index hit ATH after the selloff in March 2020 was August 18, 2020 when VIX was 21.51. By the end of the year, SPX hit ATHs 19 more times and all of them happened with VIX above 20. That is quite unusual.

The last time the stock index hit ATH with VIX above 20 was November 1999. In fact, on September 2, 2020, SPX hit ATH when VIX was at 26.57 which remains the highest VIX to coincide with an ATH in the index. The last time we had the SPX hitting ATHs with such elevated levels of VIX was 1997-1999.

The years preceding 1997 were characterized with much lower levels of VIX, just like the years preceding 2020. In fact, the lowest VIX to coincide with SPX hitting ATH was on November 3, 2017 at 9.14. Average historical VIX to coincide with the index hitting ATH is 14.92.

Since 1990 there have been a total of 614 ATHs for the SPX. Most daily ATHs on a 12m rolling basis were 87 reached on February 12, 1996. The average is around 20. In 2020 we had 33 ATHs, so far this year we have had 16.

Most people assume that with the March selloff in VIX falling off the 1yr look-back for (some) VAR models, vol will keep grinding lower now as sellers re-appear. Could be. It could also be that we are in a 1997-99 vol environment. We shall see.

This new fiscal stimulus should offer more support for US stocks

01 Thursday Oct 2020

Posted by beyondoverton in Equity

≈ Leave a comment

Tags

fiscal policy

Details are slowing coming out of a possible agreement on a new fiscal stimulus. It is a smaller package, but, nevertheless, if it passes, is still substantial as it pertains to direct household (HH) assistance which is what matters to the stock market. The UI benefits + the direct government transfers in the previous package covered more than 200% of the lost income from unemployment during March-September. As a result, total HHs savings rose by about $1.4Tn in that period. A chunk of that money went into financial assets, including stocks, judging from anecdotal evidence and data from retail brokerage accounts.

Most of the extra UI benefits have now stopped and the government transfers are smaller. However, they are still able to cover lost income from unemployment even as of September. Without a new deal, though, that won’t be possible in October, which means that HHs might have to tap into their savings to supplement their income. Which might mean, they have to sell stocks. 

Reality, though, is that the majority of that $1.4 of extra savings, up to now, was skewed to the people who do not live pay-check to pay-check and, therefore, going forward, 1) most US HHs would be in big trouble to cover expenses without a new stimulus deal,  and 2) there might not be a substantial flow of equities selling pressure from reduced savings even if there were no new deal.

So, that is why a new fiscal stimulus is likely coming, despite, seemingly, no need for it, given elevated HHs savings. In fact, the amount of HH savings is slowly turning into a similarly giant money cemetery as that is what the excess reserves at the Fed are: money which does not enter the ‘real economy’, rather it might remain stuck, ‘forever’, in financial assets. 

So, even with the reduced UI payments ($400 vs $600) and reduced direct transfers ($1000 vs $1200), the money should be more than enough to cover the lost income from unemployment. A rough calculation from the article above shows that UI benefits + direct government transfers would amount to $500-600Bn for September – December. The previous package came to a combined $800Bn for April – August (see here).

Which means there will be even more money going into savings and thus financial assets. With monetary policy on autopilot until 2023, all marginal financial liquidity, ironically enough, courtesy of the extremely skewed income distribution in the US, is now solely determined by fiscal. From a pure flow perspective, in the short term, stocks should like this status quo (economy/employment weaker) more than a rebound in economic activity.

Longer term, post the election and into 2021, a Democratic sweep might increase the risk of higher corporate taxes/regulations which will eventually weigh on corporate cash flows. But it might also increase the likelihood of future, and more generous, stimulus packages, and even perhaps, eventually, a UBI.

Trade accordingly.

New fiscal stimulus to prop the stock market: the economy will be fine without

28 Monday Sep 2020

Posted by beyondoverton in Equity

≈ 1 Comment

Tags

fiscal policy

So, I have been doing a bit more work on trying to quantify US fiscal response to Covid-19 on US household income, consumption, savings and the stock market. Most of the data, I have been using, is from BEA Table 2.6; some is from the BLS employment/compensation report. The complete data set is only updated to July, unfortunately, but I have done projections for August and September where necessary. We will get the new data set on October 1, in a few days.

Bottom line is that without a new fiscal deal, US households will start digging into accumulated substantial savings to cover losses from unemployment which will prop up consumption but, most likely, expose the stock market to the downside.

We all know that Covid-19 produced an employment shock comparable only to the Great Depression: there are still some 11.5m fewer people, or so, not employed vs to pre-Covid. The surprise (to me) was the fact that there was a 4.5% jump in weekly compensation, MoM, from February to August this year. This, on its own, cushioned a bit the overall purchasing power of the private sector.

As you can see, actually, personal income did rise immediately after Covid, and is still some 5% higher from February this year. However, for sure it was not due to a rise in employment compensation (# people employed x wage rate,) despite the rise in weekly wages (see previous chart). In fact, overall compensation is still down almost 5% from February.

The reason HH income rose, was active fiscal policy which substantially increased UI Benefit and other government transfers post Covid. The annualized numbers exaggerate a bit this, but, nevertheless, the size of the increase is beyond anything previously done and also more than offsets the decline in employment compensation (see further down).

So, what did HHs do with the extra money? Well, they did not spend them: consumption is still down about 5% from February. HHs’ savings, on the other hand, rose substantially in the meantime.

The table below breaks HHs’ cash flows net of their level from before Covid, and it is also on a monthly basis, so it is easier to see how the lost income from unemployment is more than offset by the unemployment insurance benefit payments. Then, on top of that, we’ve had further government transfer payments as part of CARES Act. No wonder the savings rate is so high!

Here is a snapshot of the same table netting off just the employment vs the benefits/transfer flows. US HHs had a negative cashflow only in March. Since then, they have net received income despite the high unemployment rate. Even in August and September, the loss income was more than offset with UI Benefits (not sure how that is possible as the UI payments stopped in July but that is what the data shows).

But both the UI payments and the government transfers are winding down. In October, US HHs might just about break even as employment compensation might not jump up to offset them.

The good news is that HHs have a very large cushion of savings on which to draw on, an extra $1.4Tn (this number also cross-references with Fed H.8 report on bank deposits). So, if anything, the economy would probably be fine. The bad news is that, to an extent that those savings were invested in the stock market, asset prices might find it difficult to rally.

So, there are two conclusions to be made. First, the extent of the fiscal support to the stock market in the past five months is not to be underestimated: if anecdotal evidence and data from retail brokerages are taken together, a big chunk of the households savings was invested in stocks. The fact that government assistance was still bigger than lost gains from unemployment in August (despite the expiry of some UI benefits in July) explains why the stock market remained bid throughout the month.

Second, the pressing need to pass the next phase of the fiscal stimulus is not to save the economy so much, but to save the stock market. Households have amassed about $1.4Tn of extra savings post Covid. As government assistance cannot cover the lost gains from unemployment going forward, without a new fiscal stimulus, some of that savings will most likely be re-directed from stocks to consumption leaving the stock market exposed to the downside.

Record liquidity leads to record net issuance of financial assets

06 Monday Jul 2020

Posted by beyondoverton in Asset Allocation, Debt, Equity, Monetary Policy

≈ Leave a comment

Tags

corporate bonds, Rates, share buybacks

At $3.2Tn, US Treasury (UST) net issuance YTD (end of June) is running at more than 3x the whole of 2019 and is more than 2x the largest annual UST issuance ever (2010). At $1.4Tn, US corporate bond issuance YTD is double the equivalent last year, and at this pace would easily surpass the largest annual issuance in 2017. According to Renaissance Capital, US IPO proceeds YTD are running at about 25% below last year’s equivalent. But taking into consideration share buybacks, which despite a decent Q1, are expected to fall by 90% going forward, according to Bank of America, net IPOs are still going to be negative this year but much less than in previous years.

Net issuance of financial assets this year is thus likely to reach record levels but so is net liquidity creation by the Fed. The two go together, hand by hand, it is almost as if, one is not possible without the other. In addition, the above trend of positive Fixed Income (FI) issuance (both rates and credit) and negative equity issuance has been a feature since the early 1980s.

For example, cumulative US equity issuance since 1946 is a ($0.5)Tn. Compare this to total liquidity added as well as issuance in USTs and corporate bonds.*

The equity issuance above includes also financial and foreign ADRs. If you strip these two out, the cumulative non-financial US equity issuance is a staggering ($7.4)Tn!

And all of this happened after 1982. Can you guess why? SEC Rule 10b-18 providing ‘safe harbor’ for share buybacks. No net buybacks before that rule, lots of buybacks after-> share count massively down. Cumulative non-financial US equity issuance peaked in 1983 and collapsed after. Here is chart for 1946-1983.

Equity issuance still lower than debt issuance but nothing like what happened after SEC Rule10B-18, 1984-2019.

Buybacks have had an enormous effect on US equity prices on an index basis. It’s not as if all other factors (fundamentals et all) don’t matter, but when the supply of a financial asset massively decreases while the demand (overall liquidity – first chart) massively increases, the price of an asset will go up regardless of what anyone thinks ‘fundamentals’ might be. People will create a narrative to justify that price increase ex post. The only objective data is demand/supply balance.

*Liquidity is measured as Shadow Banking + Traditional Banking Deposits. Issuance does not include other debt instruments (loans, mortgages) + miscellaneous financial assets. Source: Z1 Flow of Funds

April TIC data: Continuous foreign selling of US assets

16 Tuesday Jun 2020

Posted by beyondoverton in Asset Allocation, Equity

≈ Leave a comment

Tags

corporate bonds, UST

April TIC data released.

  • Heavy foreign UST selling continues.
  • Foreign selling starts to pick up also in US equities and agencies.

March broke the record for Total foreign monthly outflow.

This happened largely on the back of a record Private foreign sector outflow.

April still saw a large net foreign outflow, though not as big as March. Nevertheless, this time, the Official foreign flow reached an all-time low.

This is significant because the 12-month rolling cumulative total foreign flow in US turned negative by a large amount. This is very, very unusual.

Foreigners are still focused at the moment on selling primarily USTs.

While in the past, private foreign accounts may have bought USTs even when official foreign accounts were selling, in the last two months (April-March), private foreign money turned sellers in size. In fact, their outflows have been several times bigger than the official foreign account outflows. This most recent selling put the 12-month rolling UST private foreign flow in negative territory in March. It reached an all-time low in April. The 12-month rolling UST official foreign money flow is also close to its all-time record low, reached in November 2016.

On the US equities side, unlike in March, though, this time foreigners were net sellers. The total outflow was not that large by historical standards, but the official foreign outflow was.

Foreigners continued to buy US corporate bonds, especially official foreign money. Nothing new there.

Finally, on the agencies side, official foreign accounts were a rather unusual and large seller.

Conclusion: The continuous high level of total foreign US assets outflows in April is interesting and could herald a change in trend of previous USD inflows. We can see that by looking at the rolling 12-month data which turned negative in March and is accelerating lower. In theory, there shouldn’t have been any forced pressure on foreign accounts to exit US assets in April, as Fed/Other Central Banks swap and repo lines were already in place. If this continues, the USD may be in bigger trouble than initially thought. See here, here and here.

Buying bankrupt company shares: eventually it hertz

15 Monday Jun 2020

Posted by beyondoverton in Equity

≈ Leave a comment

Tags

bankruptcy

“General Motors Corp. filed for bankruptcy protection, got kicked off the New York Stock Exchange and out of the Dow Jones industrial average. And its stock has mostly been rising ever since. In fact, GM has been one of the hottest issues on Wall Street over the last six trading sessions, surging from 61 cents totoday’s closing price of $1.59 in the electronic pinksheets.com market – a gain of 161%. (…) As I’ve written before, there’s a universe of traders out there who love to play around with big-name stocks that end up in bankruptcy. You can’t explain the action based on any fundamentals. It’s just a minute-to-minute, hour-to-hour trading game. (…) We know how this will end. But between now and then, for some gamblers playing GM is better than a trip to Vegas.”

“GM’s stock keeps trading but it is probably worthless” Tom Petruno, Los Angeles Times, June 10, 2009

The price action in Hertz shares post-bankruptcy is quite normal (up to “Bankrupt Hertz granted approval to sell up to $1Bn in shares”, but that is another, important, story). The elevated activity of retail investors in trading the shares of bankrupt companies is a feature of this particular market. For a lot of them it ends badly, but most of them are doing it for the fun of gambling anyway.

I am not a bankruptcy expert or a bankruptcy lawyer and I have never been involved in a company restructuring (plenty of bond restructurings though). Let’s say that before Hertz, I knew nothing about bankruptcies. What I found fascinating with that recent episode, though, is that even people who should know about corporate bankruptcy (equity portfolio managers) did not know much either. I was intrigued by the Hertz case as it looked quite bizarre and indeed the price action seemed against all common sense.

As I embarked on researching the topic, it turned out that even the academic literature on this is quite scarce. Of course, there is a lot that addresses bankruptcy cases and issues but there is little on trading, valuations or performance of stocks which have entered bankruptcy. There are a few reasons for this perhaps. First, most bankrupt stocks are delisted from major exchanges before or around bankruptcy filings. Second, institutional ownership declines massively post-bankruptcy, with 90% of shares owned by retail thereafter. Third, research coverage drops as a result. And fourth, yes, the market for bankruptcy shares, it turns out, is quite inefficient, for example, very difficult to short (inability to source borrowing) and very wide bid-offer spread (all due to thin institutional involvement).

To do my research I relied extensively on two papers: 1. “Investing on Chapter 11 stocks: Trading, value, and performance” by Yuanzhi Li and Zhaodong Zhong 2. “Gambling on the market: who buys the stock of bankrupt companies?” by Luis Coelho and Richard Taffler. The below is my summary of some of the topics discussed in these as they pertain to markets.

There are quite a few misunderstandings about bankruptcy procedure. First, when companies get delisted, they don’t just disappear but continue to trade on the Pink Sheets, which is an electronic quotation system. Second, even though there are quite a few limitations, as mentioned above, trading activity is quite brisk. Third, it is quite common for prices to bounce immediately after bankruptcy announcements as institutional shareholders tend to choose to cover their shorts on the major exchanges than go through the Pink Sheets or indeed through the bankruptcy proceedings. Fourth, although in the majority of cases shareholders do get zero, there are precedents where shareholders gain, sometimes substantially, when buying the stocks immediately after bankruptcy announcements.

So, the fact that Hertz share price rose in these circumstances should not be a surprise given that the company was one of the most shorted stocks on the main exchanges for a number of years before. Moreover, it is quite common for share prices to rise immediately after declaring bankruptcy, even independent of short covering, on the back of a phenomenon called violation of APR (absolute priority rule) which occurs “when creditors are not fully satisfied before shareholders get any payments”.

There are two main reasons to do that.  One is rational: there is value in buying cheap and deep out of the money call options on a company’s assets, operations, brand, etc. (some of them, some of the time, will pay off handsomely). There are examples of companies exiting bankruptcy with the original shareholders having gained from owning the shares from the day bankruptcy was officially announced.

The second reason is irrational. There is a massive non-linearity in the return: you get either zero or a lot. And who doesn’t like a cheap lottery ticket! The average price of bankrupt company shares is actually around $2 (yes, Hertz is well within that price range at the moment) in the month immediately post-bankruptcy, which to a lot of retail investors, looks, yes, irrationally, cheap.

“The human propensity to gamble seems to be able, at least partially, to explain why stocks of bankrupt firms continue to be actively traded by retail investor even after the formal announcement of bankruptcy.”

But don’t be deluded. There is only an ‘illusory profit opportunity’. The average return on holding the shares of bankrupt companies into the actual process of restructuring is a negative 28%. Limited possibility of short selling and not enough company disclosure, contributes to share prices reflecting a more optimistic scenario than actual reality and being much higher initially than, perhaps, ‘fundamental value’. That is why, there is a persistence of negative returns from a buy-and-hold strategy in bankrupt company shares: at the end of the bankruptcy proceedings, the true value of the stock is revealed. That does not mean though that buyers can not make money buying and selling the stock while still in the Pink Sheets.

Trading in the stocks of bankrupt companies whether immediately post-bankruptcy, as with Hertz, or in the Pink Sheets, is much more ‘suitable’ for retail investors, who, unlike institutional investors are more prone to overvalue risky assets and to prefer lottery-like payoffs. The current stock market activity, in general, was dominated by retail investors even before Hertz to an extent last observed probably during the dotcom boom. So, perhaps we are focusing too much on this phenomenon, and, in the process, exaggerating the effect retail investors have on the market, away from what that normally is.

Liquidity down, equities up, Fed around the corner

08 Monday Jun 2020

Posted by beyondoverton in Equity, Uncategorized

≈ 1 Comment

Tags

Fed

Repo volumes are rising in a similar fashion to the beginning of the crisis in February. Liquidity is leaving the system. Last two days, repos (O/N and term) rose above $100Bn. S&P500 topped on February 19 while repo volumes were about half of what we are seeing today. By the time we hit $100Bn in repos (March 3), the index had dropped 10%.

We had about two weeks (March 3-March 22) of repos printing about $128Bn on average per day. S&P 500 bottomed on March 23 as the Fed started stepping in with its various programs. Repos went down below $50Bn on average a day. More importantly liquidity started flooding the system. Reverse repos skyrocketed from $5bn on average per day to $143Bn a day by mid-April! Equities rallied in due course.

April/May, things went back to normal: repo volumes between $0Bn and $50Bn a day and reverse repos averaging about $2-3Bn a day->Goldilocks: liquidity was just about fine. Equities were doing well. Then in the first week of June, repos jumped above $50Bn, and last Friday and today they went above $100Bn. Reverse repos are firmly at $0Bn: they have literally been $0Bn for the last 4 days.

Again, just like in February, liquidity is starting to get drained from the system. By that level of repo volumes in March, equities were already 10% lower from peak. S&P500 is just a couple % below that previous peak, but Nasdaq is above!

I am not sure why the market is here. It could be that, in a perfect Pavlovian way, investors are giving the benefit of the doubt to the Fed that it will announce an increase of its asset purchasing program at this week’s FOMC meeting. If it doesn’t, US equities are a sell.

And don’t be fooled by no YCC or any forward guidance. The Fed needs to step in the UST market big way. YCC on 2-3 year will do nothing. Fed needs to do YCC on at least up to 10yr. As to really address the liquidity leaving the system, Fed needs to at least double its weekly UST purchases.

← Older posts

Subscribe

  • Entries (RSS)
  • Comments (RSS)

Archives

  • January 2023
  • December 2022
  • November 2022
  • August 2022
  • February 2022
  • April 2021
  • November 2020
  • October 2020
  • September 2020
  • August 2020
  • July 2020
  • June 2020
  • May 2020
  • April 2020
  • March 2020
  • February 2020
  • January 2020
  • December 2019
  • November 2019
  • October 2019
  • May 2019
  • March 2019
  • February 2019
  • January 2019
  • December 2018
  • November 2018
  • October 2018
  • September 2018
  • August 2018
  • June 2018
  • May 2018
  • March 2018
  • February 2018
  • January 2018
  • November 2017
  • October 2017
  • September 2017
  • August 2017
  • July 2017
  • June 2017

Categories

  • AI
  • Asset Allocation
  • blockchain
  • China
  • De-urbanization
  • Debt
  • Decentralization
  • EM
  • Energy
  • Equity
  • FX
  • g88kboy
  • Monetary Policy
  • Politics
  • Questions
  • Quotes
  • The last man standing will laugh
  • Travel
  • UBI
  • Uncategorized
  • VR

Meta

  • Create account
  • Log in

Blog at WordPress.com.

  • Subscribe Subscribed
    • BeyondOverton
    • Join 74 other subscribers
    • Already have a WordPress.com account? Log in now.
    • BeyondOverton
    • Subscribe Subscribed
    • Sign up
    • Log in
    • Report this content
    • View site in Reader
    • Manage subscriptions
    • Collapse this bar
 

Loading Comments...