Really interesting the divergence of monetary policy in Norway and Canada, and now possibly, Sweden with the rest of the DM/EM world in the last 12 months*. While pretty much every other central bank in the world has turned dovish, Norges hiked four times since September last year, while Bank of Canada has hiked 5 times since mid 2017. And last week, against all odds and expectations, Riskbank also surprised by pretty much guaranteeing a hike at its December meeting. It’s questionable whether hikes in either country was/is warranted looking strictly at economic activity.
Despite a spike in core inflation in early 2019, something which Norges had actually expected to be temporary, inflation is back below 2%. Both Canada’s and Sweden’s inflation spiked up in mid 2018 and have recently retreated back below 2%. Growth in all three counties has actually been more elevated than in neighboring Europe or US but growth was never the reason their respective central banks cut rates before, so it does not seem to be the reason they are now hiking. In fact, looking at weakening domestic demand and rising unemployment rates in Sweden, there are probably more reasons to cut than hike now.
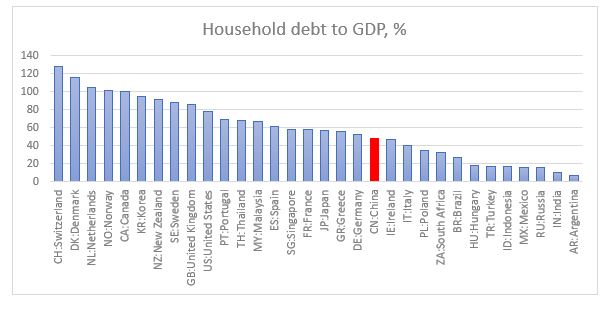
So why are they hawkish? One theory is that the central banks are worried about rising household leverage with private debt to GDP in each close to the highest in the world. The thing is, other countries in a similar situation have chosen to go the opposite way. Australia, New Zealand, Korea, which also have high household debt ratios, tried to be ‘hawkish’ but have been aggressively cutting over the last 12 months on the back of slowing global demand.
The problem with hiking rates when over-indebtedness is high is that you are ‘inviting’ financial instability and when that is one of your mandates, it is probably not such a wise choice. Is that why the Riskbank has said it would hike only once and stop at 0%?
Another theory is that the Riskbank is
preparing to introduce the e-krona and does not want to be dealing with the arb
of negative rates. I find that a poor excuse to hike as well.
And finally, some people are looking for a symbolic meaning of Sweden going back to 0% after being the first modern central bank to go below, 10 years ago. I don’t know. My guess is that it is more likely to be part of the experimentation process, but that ultimately it would turn out to be too early not to be a policy mistake.
*In Israel, the UK and the Czech Republic the last interest rate moves were a hike. However, Israel hiked only once, in November last year (from 0%) and with inflation at 0.5% and below the target range of 1-3%, the central banks has removed any prospect for a further rate increase and confirmed inflation is in a downward trend. UK is a special case of Brexit and deserves a post on its own. The Czech Republic, I have to admit, is a proper outlier here with both growth and inflation bucking all trends in Europe and, therefore, also deserves its own blog post.
When speaking to investors, the two most common questions I get asked, given rather extreme levels and valuations of (most) asset classes, are:
1.Should my
asset allocation change dramatically going forward? and
2.What is
the best risk diversifier for my portfolio?
I have previously
opined on this here.
Very broadly speaking, on the equity portion, one should reduce exposure to US
equities and increase allocation to EM equities (unhedged). On the fixed income
side, one should move completely out of the long end of UST and put everything into
T-Bills to 2yr UST; exposure to EU-denominated sovereigns should also be reduced
to zero at the expense of EM local (unhedged) and hard currency bonds. In the
normally ‘Others’ section of the portfolio, one should include soft commodities
(or alternatively, scale everything down to make space for them). Finally, in
terms of FX exposure, apart from EM currencies through the unhedged portions of
the bonds and equities allocations, one should hedge the USD exposure with EUR.
Here I am
adding some more general thoughts on what I consider to be the best portfolio
diversifier for the next 5 years, possibly even longer. To my knowledge, ‘noone’
is invested in any meaningful way in Chinese bonds (I am excluding the special
situations credit funds, some of which I know to be very active in the Chinese credit
space – but even they are not looking at Chinese government or bank policy
bonds).
The big
fixed income funds, the pension/mutual funds, the insurance companies have zero
allocation to Chinese bonds. Some of the index followers started dipping their
foot in the space but most of them are either ignoring China’s weight or are massively
underweight the respective index. Finally, a sign of how unloved this market
is, on the passive/ETF side, the biggest fund is just a bit more than $100mm.
Let me just
say here that we are talking about the third (possibly even the second, by the end
of this year) largest fixed income market in the world. And no one is in it?
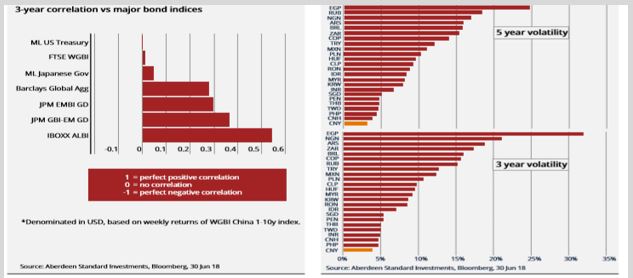
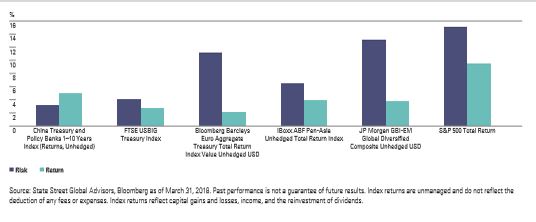
Chinese bonds merit a rather significant place in
investors’ portfolios. They offer diversification thanks to their low
correlation and superior volatility-adjusted return relative to other developed
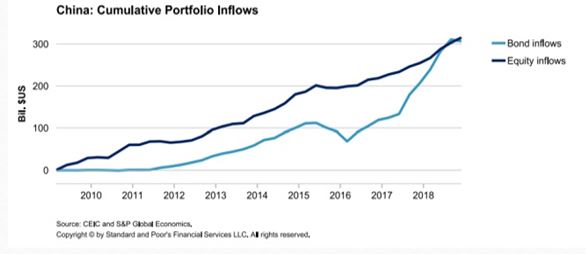
and emerging markets. In addition, Chinese bonds are likely to benefit significantly from
both the passive and active flows going forward: I expect up $3 trillion of foreign inflows
over the next decade on the back of indexation.
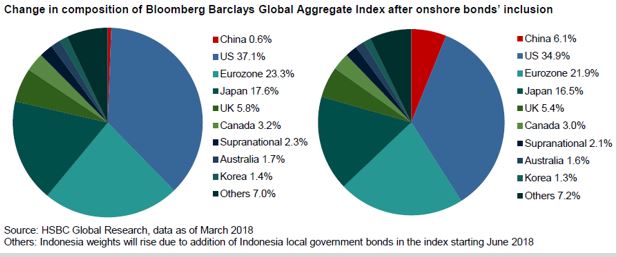
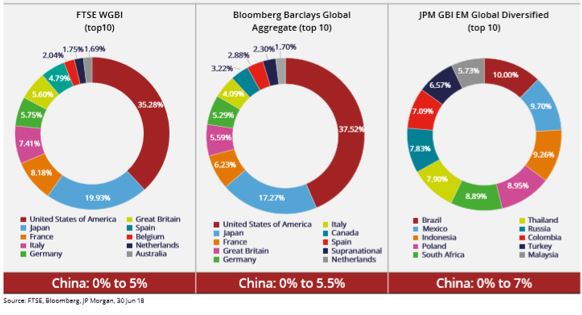
Bloomberg Barclays Global Aggregate Index (BBGAI) and JP Morgan Global
Diversified have already confirmed Chinese bonds inclusion in their respective
indices. FTSE Russell WGBI is likely to do that next March. This inclusion is a big deal! It
will have huge repercussions on the global bond industry. It is a much more
important and far-reaching development than a similar inclusion of Chinese
equities in global indices last year. And the market is not only not ready for
this, but it is also underestimating its impact overall.
China is a
highly rated sovereign with a much better risk/return profile than other
high-quality alternatives. Chinese bonds
offer a significant scope for portfolio diversification because they have very low correlation to global interest
rates which means lower return volatility.
Therefore, China sovereign bonds offer a much
better volatility-adjusted return than Global Bonds, EM Hard Currency and Corporate Bonds, US HY and
Equities, Global Equities and Real Estate.
Among the plethora of negatively yielding sovereign bonds, China sovereigns offer a good pick-up over other DM bonds while yielding not too much lower than EM bonds. In addition, they offer much more opportunity for alpha generation than both DM or EM sovereign bonds. This alpha partially comes from the fact that Chinese fixed income market is still not so well developed and partially from the fact that there are not many sophisticated foreign players in it, as access to it is still not that straightforward.
However,
things are rapidly improving on the access side. Bond Connect has already
started to revolutionize the onshore market. Before the setting-up of CIBM, and
especially Bond Connect in 2017, access to the China bond market was extremely
cumbersome through a lengthy process requiring approvals from high authority (QFII
and RQFII). Bond Connect, on the other hand, does not require domestic account
and custody while following international trading practices. In addition, not
long ago, it started real-time settlement and block trading. As a result, Bond
Connect volumes doubled.
Moreover,
in September this year, SAFE decided to scrap the quota restrictions on both QFII
and RQFII, while Euroclear signed a memorandum of understanding with the China
Central Depository & Clearing to provide cross-border services to further support
the evolution of CIBM. That opens up the path for Chinese bonds to be used as
collateral in international markets (eventually to become euro-clearable), even
as part of banks’ HQLA. Such developments are bound to make access to the
Chinese bond market much easier for overseas investors.
September proved
to be a very important month for the China bond market also because the authorities
finally delivered on the interest rate reform agenda. The central bank eliminated the benchmark policy loan and deposit
rates in favor of a more flexible reference rate. This should be positive
for yield curve formation and the continued expansion of interbank liquidity.
China does not have some of the weaknesses typical of emerging markets. On the opposite, it has very little sovereign FX debt, has large FX reserves, and it is a net creditor to the world. Moreover, some of the foreign debt is most likely offset by foreign assets.
Corporate-sector leverage, however, is still high, though default rates, despite lots of recent media focus, are still relatively low. On the other hand, the recovery rates are high, while the official, banking and household sectors are in relatively strong position which, reflects degrees of freedom to deal with these challenges. China has large amounts of debt with implicit state backing and a culture averse to defaults. In effect, the government controls both the asset and the liability side of the domestic debt issue thus a debt crisis is much less likely than in a fully free-market economy. The fact that China has the ‘fiscal’ space to deal with the private debt issue is one big advantage it has over DM countries with similarly high private debt burdens but which have also already used the option of shifting that debt to the government balance sheet.
The high debt issue and the authorities’ attitude to it, the structure of the economy (export-driven) as well as the potential transition from an extremely high growth rate to a more ‘normal’ one, makes China’s situation very similar to Japan’s in the late 1980s. Yet, there are also major differences. China’s urbanization rate is much below Japan’s before the 1990 crisis, the real estate bubble is only in the top tier cities as opposed to country-wide as in Japan, the Renminbi is more likely to depreciate going forward than massively appreciate which is what happened to the Yen after the Plaza accord.
The high debt issue is a problem China shares not only with Japan but also with most advanced countries in the world. Similar to them, China is fully sovereign (the government has full control of the overall economy balance sheet; the currency peg is a “question mark”, not a real issue given China’s large positive NIIP). Of all these advanced economies with similarly high non-financial debt to GDP, only China has not reached the zero-bound*. It is, therefore, likely for the Chinese policy rate to continue to move lower until it eventually hits 0%.
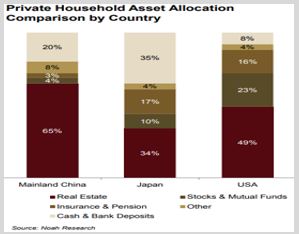
Similar to Japan, it has a high household savings rate and a rapidly ageing population. Yet, Chinese households have relatively low exposure to financial assets and especially to bonds. Given the policy agenda of financial market reform and the life-cycle savings behavior (i.e. risk-aversion increases with age), Chinese households’ allocation to bonds is bound to increase manifold. Moreover, with the looming of the property tax law (sometime next year), I expect the flow into bonds to start fairly soon.
This
flow aspect makes the case for investing into China bonds much stronger. Given the size of the Chinese fixed income market, its
rapid growth rate and the reforms undertaken most recently, global bond indices had ignored
Chinese bonds for too long. However, last year BBGAI announced that it would
include China in its index as of April 1, 2019. Purely as a result of this, China bond inflow is expected to reach
$500Bn by 2021 as the weights gradually increase from 0.6% to 6%. By then
China will be the 4th largest component in the index (after US,
Japan and France – and bigger than Germany!)
Before
BBGAI’s inclusion, there had never been a bond market that large, that was not
included in an index, as the Chinese bond market. In fact, China already represents the third largest bond market in the world,
growing from $1.6 trillion in 2008 to over $11 trillion now.
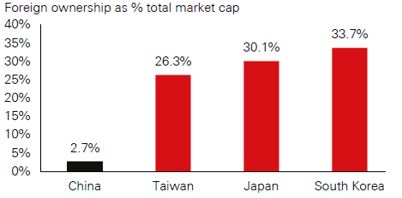
And even after these
inflows, China bonds are still likely to remain relatively under-owned by
foreigners as they would represent just 5% of China’s total bond market (currently foreign ownership of the overall bond market is around 3%,
PBOC expects it to reach 15%). Foreign ownership of China sovereign bonds (CGBs)
is slightly higher, but even at around 6%, it is materially lower than in other
major sovereign bond markets. This under-ownership is even more pronounced relative
to the emerging market (EM) universe (the ranges there are between 10% and 50%).
Finally,
foreign investors are expected to continue to get very favorable treatment from
the Chinese authorities. The government has an incentive to make things easier as they need
the foreign inflows to balance the potential domestic outflows once the current
account is liberalized. For example, the tax changes implemented last year allowed
foreigners to waive the withholding tax and VAT on bond interest income for a
period of three years.
I am still
frankly shocked how little time investors have to discuss these developments
above but, at the same time, how eager they are to discuss the Chinese economy
and the trade tensions. From one hand, they acknowledge the importance of China
for their investment portfolio, but on the other, they continue to ignore the
elephant in the room being the Chinese bond market. I understand that this choice
is perhaps driven by investors’ inherent negative bias towards any Chinese
asset, but the situation between asset and asset is much more nuanced.
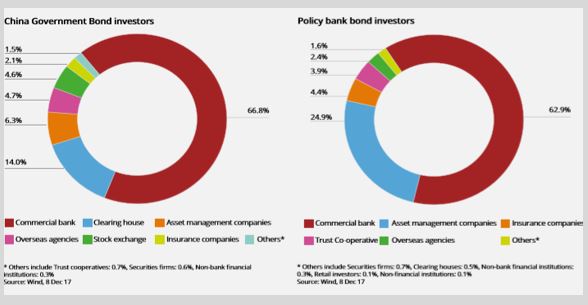
In the
fixed income space, one can be bearish select corporate credit and bullish CGBs
or bank policy bonds (in fact, the more bearish one is on corporate credit, the
more bullish sovereign bonds one should be). Finally, I do acknowledge that the
big unknown here is the currency. But even there, the market has become much
more sophisticated: one can now use a much longer CNY/CNH forward curve to hedge.
Bottom line is that if you are still looking for a fixed income alternative to diversify your portfolio and you are not looking at Chinese sovereign bonds as an alternative, you are not being fiduciary responsible.
*For more details, see JP Morgan’s economics research note, “China’s debt: How will it evolve?”
In the current debt-backed system,
the majority of money is still loaned into circulation at a positive interest rate.
Even in Europe and Japan, where base interest rates and sovereign bond yields
are negative, the majority of private debt still carries a positive interest
rate. This structure inherently requires a constantly growing portion of the
existing stock of money to be devoted to paying solely interest. Thus, the rate
of growth of the money supply has to be equal to or greater than the rate of
interest, otherwise more and more money would be devoted to paying interest
than to economic activity.
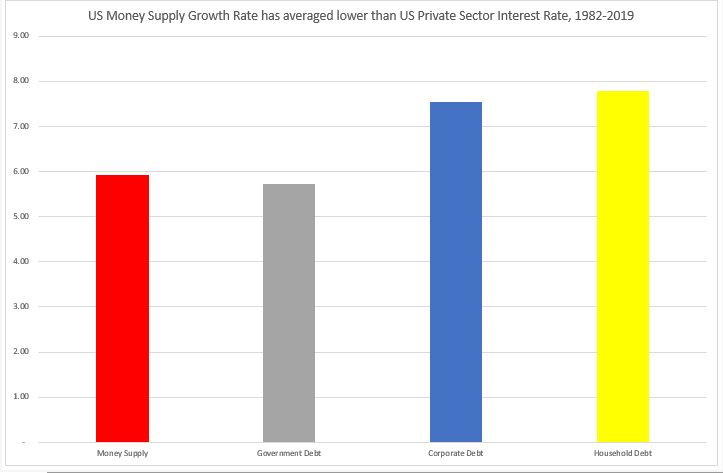
The long-term average growth rate of US money supply is around 6%, which is only slightly higher than the average interest rate on US government debt but it is below both the average US corporate interest rate and US household debt. While I have used the UST 10yr yield as the average yield on US government debt (the average maturity of US debt is slightly less than that), the estimates for both US corporate debt and US household debt are very generous. For the former, I used the average yield on Aaa and Baa corporate bonds, and for the latter I used a weighted average interest rate between mortgage debt and auto loans (I have used 2/3 and 1/3 weights). I have not included the much higher yield on US corporate junk bonds which comprise a growing proportion of overall corporate debt. I have also not used credit card/consumer debt, which has a much higher interest rate than auto loans, and also student loan debt which carries approximately similar interest rate to auto loans. Just like for BBB and lower rated US corporates, credit card and student loan debt are a much higher proportion of total US household indebtedness compared to before the 2008 crisis.
I estimate the long-term average economy-wide interest rate as a weighted average of government, corporate and household debt – with the weights being their portions of the total stock of debt. That rate currently is about 7%, still higher than the average money supply growth rate since the early 1980s. Over the last four decades, US money supply has not only not grown enough, on average, to stimulate US economic growth, but has been, in fact even, below the overall interest rate in the economy. Needless to say, this is not an environment that could have persisted for a long time.
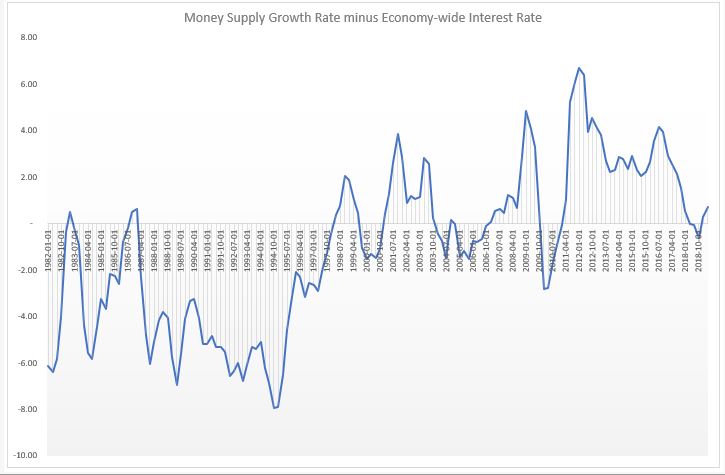
Indeed, if one calculates the above
equivalent rates for the period 1980-2007, the situation would be even more
extreme (see Chart below). In fact, until the late 1990s, money supply growth
had been pretty much consistently below the economy-wide interest rate. Only
after the dotcom crisis, but really after the 2008 crisis, money supply growth
rate picked up and stayed on average above the economy-wide interest rate.
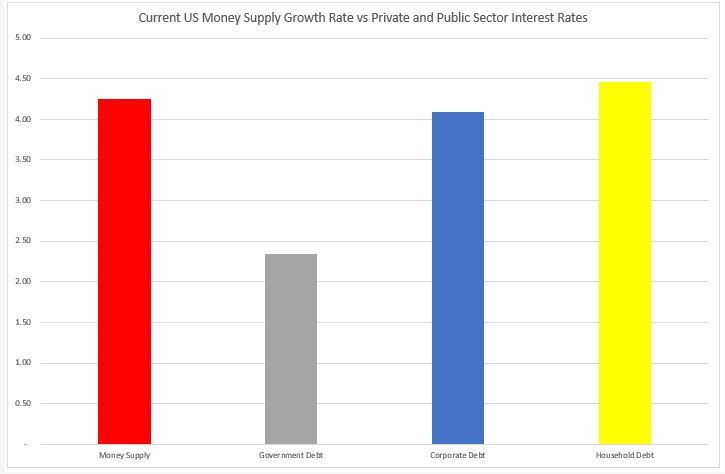
What is the situation now? The current money supply growth rate is just above the average economy-wide interest rate; respectively above the government and corporate interest rates but below the household interest rate (data is as of Q1’2019).
It is also still below the combined average private sector interest rate.
So, even at these low interest
rate, US money supply is just about enough to cover interest payments on
previously created money. And that is assuming equal distribution of money.
Reality is that it is only enough to cover interest payment on public debt. And
even in the private sector, money distribution is very skewed: corporates have
record amount of cash but it is only in the treasuries of few corporates. The
private sector, overall, can barely cover its interest payment, let alone
invest in CAPEX, etc.
The deeper question is whether money creation should indeed be linked to debt at positive interest rate. In fact, we have already answered that question, and gone beyond, with some portion of money creation in Europe and Japan actually happening at negative interest rate. In effect, the market is trying to correct for all those decades when money creation substantially lagged interest payments: money there is starting to decay.
Demurrage money is not unusual in history. Early forms of commodity money, like grain and cattle, was indeed subject to decay. Even metallic money, later, on was subject to inherent ‘negative interest rates’. In the Middle Ages, in Europe, coins were periodically recoiled and then re-minted at a discount rate (in England, for example, this was done every 6 years, and for every four coins, only three were issued back). Money supply though, did not shrink, as the authorities (the king) would replenish the difference to find his own expenses. In 1906, Silvio Gesell proposed a system of demurrage money which he called Freigeld (free money), effectively placing a stamp on each paper note costing a fraction of the note’s value over a specific time period. During the Great Depression, Gesell’s idea was used in some parts of Europe (the wara and the Worgl) with the demurrage rate of 1% per month.
The idea behind demurrage money is
to decouple two of the three attributes of money: store of value vs medium of
exchange. These two cannot possibly co-exist and are in constant ‘conflict’
with each other: a medium of exchange needs to circulate to have any value, but
a store of value, by default, ‘requires’ money to be kept out of circulation. Negative
interest rates in effect split these two functions.
Seen from this point of view, negative interest rates may not be a temporary phenomenon just to spur lending. On the opposite, negative interest rates may be here to help reduce the overall debt stock in the economy and to escape the deflationary liquidity trap caused by the declining marginal efficiency of capital.
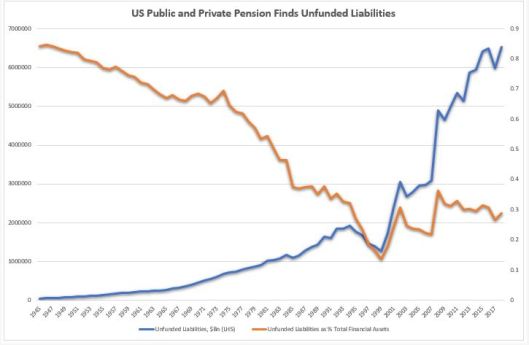
At presentations you will see the blue line below.
How many times have you seen the red line?
Pension funds unfunded liabilities have indeed been on the rise, especially after 1999. But so have pension funds assets. So much, that the ratio between the two has been declining (which is the natural, long-term trend) since 2008.
In fact, for the whole period between WW2 and 1984, unfunded liabilities were always bigger than funded liabilities. In 1999, unfunded liabilities hit an all time low of 25% of funded liabilities and even though that ratio has risen since then to 75%, it is still much closer to the bottom of the whole period since 1945.
So, is there a pension fund crisis?
Maybe, but it is not obvious to me that it is anything
bigger than at any other point in history before the 1990s.
Could there be a pension fund crisis?
Of course. But you know what is going to happen (as long as
the US is fully sovereign), the Treasury will bail out the pension fund
industry just as it bailed out the fund management industry in 1988 following
the Asian/Russia crisis, and the banking, insurance and auto industry following
the 2008 financial crisis.
This, sadly, does not prevent that future pensioners might
be exposed to some misguided government attempts to respond to this supposed
pension fund crisis by extending the retirement age.
Bottom line is that 1) pension funds unfunded liabilities are not even close to being in a crisis and 2) any fully sovereign government is in a position to provide all the necessary resources to secure comfortable retirement to its people.
We have advanced as a society to such an extent that the only hurdle to a normal life to all at the moment is our antiquated rules of accounting, not our lack of resources.
*Betteridge’s law of headlines: “Any headline that ends with a question mark can be answered by the word no.”
There seem to be three aspects of the recent debate about China’s private credit build-up:
1) Is it excessive? Yes, but it is not extreme.
2) Has it been misallocated? Probably yes, but not necessarily more than in other countries now or in earlier stages of development.
3) How will the authorities handle the inevitable credit burst? That remains to be seen, but due to its unique political system, China seems to be more in control than other countries which have undergone a similar fate Question is whether this control will result in a positive outcome.
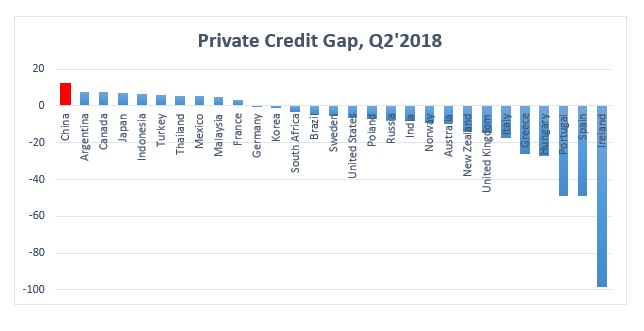
China’s recent credit build-up is indeed big: its recent private credit-to-GDP gap (a BIS indicator measuring the speed of credit creation now relative to its long-term trend) is currently the largest in the world.
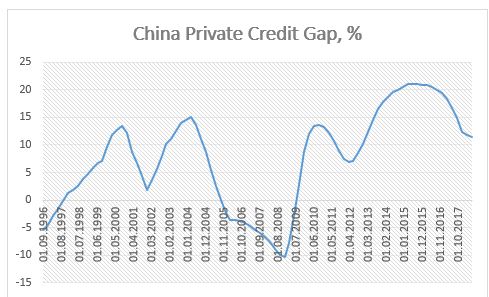
China’s credit build-up seems to have accelerated especially so after the great financial crisis in 2008.
However, private credit creation growth in China reached a top (using four quarters MA of the credit gap as an indicator) sometimes in 2015 and has been decreasing since then.
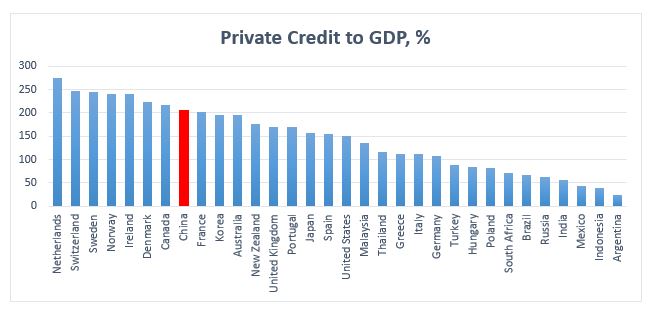
Indeed, China’s absolute private credit to GDP ratio is nowhere near some other countries’ extremes.
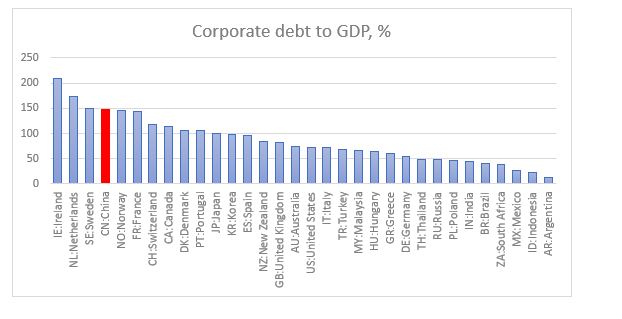
It is the corporate sector which has levered…
…with households still relatively unlevered.
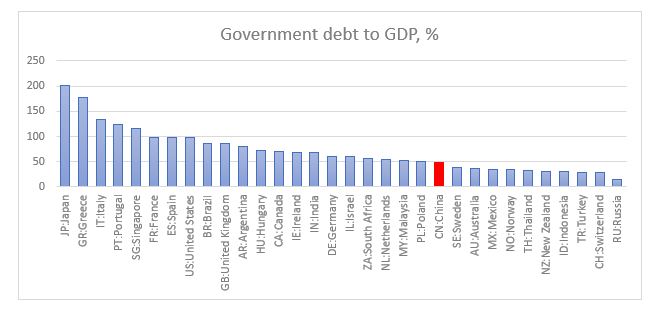
And of the corporate sector, most of the debt is concentrated in the SOEs. Finally, its government sector is unlevered, leaving the total (private + public) credit to GDP even lower relative to majority of other countries.
Bottom line is, China seems to have a lot of credit space left, giving it some room for “a beautiful deleveraging”.
The fact that most of the credit is in CNY gives a lot of flexibility of how that deleveraging is done – on China’s own terms (there is some foreign currency debt but a lot of it is either matched by corporate foreign currency assets or covered by the country’s own FX reserves).
Having travelled extensively throughout the whole country, I can confirm that there are ghost cities but the state of the overall infrastructure, pretty much everywhere, is first class, probably on par, or even better than most of continental Europe while putting US/UK infrastructure to shame. Having travelled also through all of Central Asia and after spending a month in the Philippines and now in Malaysia, I can also attest that the alternative, not spending so much on infrastructure, is infinitely worse.
So, by investing in real estate and infrastructure projects, and given its large population which is emerging from decades of under-development, is China misallocating more capital relative to:
the developed world, particularly, UK and US, where since the 1980s majority of credit created was against existing (unproductive) assets like residential real estate and financial assets for speculative purposes, leaving current infrastructure in a crumbling state? That’s in sharp contrast to the period between WW2 and the 1980s when credit was allocated to the production of goods and services and infrastructure projects like the interstate highway system in the US (a period more comparative to China’s developments now, and one largely heralded as the golden stage of economic growth).
the developing world, which similar to China now is also in need of massive infrastructure development but instead national capital has been syphoned off to offshore wealth centres? Yes, there has been private capital outflow from China as well but it would have been much bigger had the capital account not remained closed.
It would take time before we know for sure whether the decisions Chinese leaders are making are beneficial for the country or not. It is fairly likely, though, that this credit expansion is not sustainable. Should this boom be followed by a bust, we could be fairly certain that the situation would be carefully managed by the authorities, unhindered by either hostile domestic political opposition, like in the majority of the democratic Western world or by foreign creditors, like in the majority of the developing world.
How would they handle it? If history is any guide, they did a pretty good job both during the Asian crisis in 1997/98 and the great financial crisis of 2008. Third time lucky?
I expect the authorities to continue building up the social safety net – pension and health care system – alongside expanding and improving the financial assets universe. They could simultaneously deflate the real estate bubble, by starving it of additional capital and inflate financial assets by encouraging diversification into them. Unlike, developed world countries where household wealth generally collapses during crises, Chinese households could come out unscathed from this as they are unlevered. In addition, any losses on their real estate portfolio could be offset by gains in their financial assets portfolio. Finally, with the right social safety net in place, they would also feel more secure for their future than before and therefore welcome such an outcome.
Answer: Depends on the size of the overall financial system balance sheet and whether it is deleveraging/leveraging.
This is a follow up on a previous post addressing the rationale for a continued increase of the major central banks’ balance sheet barring a sudden rise in the ‘private’ banks’ balance sheets.
Summary: We have been used to a small and relatively stable central bank balance sheet because before the 2008 financial crisis, the banking system balance sheet had been steadily growing. However, post the crisis, the banking system started deleveraging across the developed world. To avoid a continuation of the financial crisis, the central banks there had no choice but to leverage, i.e. increase their balance sheet.
Going forward, the size of the central bank balance sheet will be very much determined by what happens with the banking system balance sheet as a whole: if banks continue with the deleveraging, something which is more than likely given the plethora of financial regulations (Dodd-Frank, Basel III, MIFID2, FATCA, AMLD, AIFMD, CRS, etc.), the central bank may have to continue to expand its balance sheet or face another financial crisis.
Background
Since the 2008 financial crisis, to most economic observers, central banks have been increasing their balance sheets in order to facilitate easier economic conditions having exhausted their conventional means to do so. There is a strong debate among economists, investors and market practitioners, in general, about the effectiveness of such policies. I argue that the direct economic issues (growth, inflation) may have been of secondary importance to the reasoning behind the increased central bank balance sheets.
Central bankers’ primary objective may have been financial stability, including maintaining a stable rate of growth of the country’s total financial balance sheet. In that sense, some central banks’ balance sheet may need to grow even larger if the ‘private’ banking sector continues to deleverage.
On one hand, central banks’ balance sheets are unique in the sense that they act as the lender of last resort: they control, and, to a certain extent, regulate the money supply. That’s the conventional view of central banks. On the other hand, they are an integral part of the country’s financial sector, and, therefore, cannot be viewed in isolation.
The ‘private’ and central banks’ balance sheets are indeed linked together. We have been used to the former generally rising, especially so after the great financialization of the economy beginning in the 1980s. Therefore, we have taken it for granted that the central bank needs to just ‘sit back and relax’: there was no need for it to do any heavy lifting, i.e. the central bank’s balance sheet did not need to rise relative to GDP or to the whole financial sector’s balance sheet.
Since 2008, however, we have seen the private banking system heavily deleveraging in the US and EU. In Japan, the deleveraging actually started in the mid-1990s when the ‘private’ banking system’s balance sheet started shrinking relative to GDP. In order to maintain financial stability, the central banks in these respective countries needed to start to increase their balance sheet at a much faster pace than GDP and, more importantly, than the rate of deleveraging of the ‘private’ banking sector.
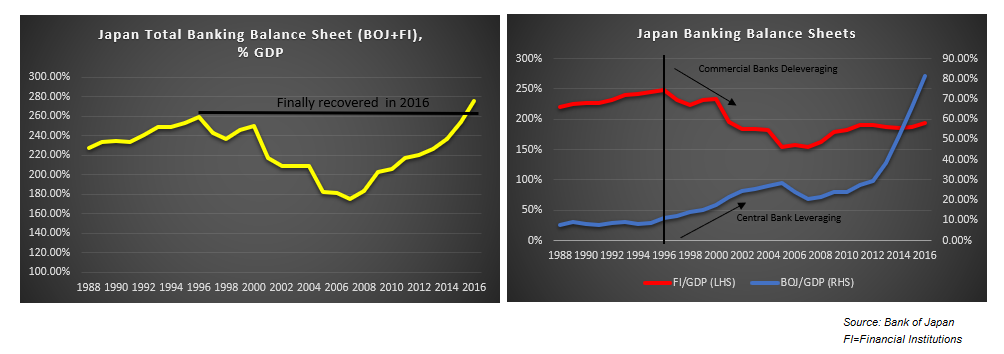
Japan
Even though it started properly leveraging (QE) only in the early 2000s, the Bank of Japan (BOJ)’s balance sheet started growing relative to GDP at the same time the domestic commercial banks’ balance sheet started deleveraging in the mid-1990s (see the chart on the right hand-side of the panel below). Nevertheless, the total financial system balance sheet (BOJ + the commercial banks) continued to decline between 1995 and 2007 (see the chart on the left-hand side of the panel below). The BOJ should have expanded its balance sheet much more back then.
Ironically, it was after the 2008 GFC that the domestic commercial banks’ balance sheet in Japan started growing again in line with also the BOJ’s balance sheet. As a result, the total financial system balance sheet also started growing. However, it took until 2016 for it to reach its previous peak from the mid-1990s. That was mostly thanks to the BOJ heavily increasing its balance sheet by starting to buy also private assets – corporate bonds, REITs, equities.
EU
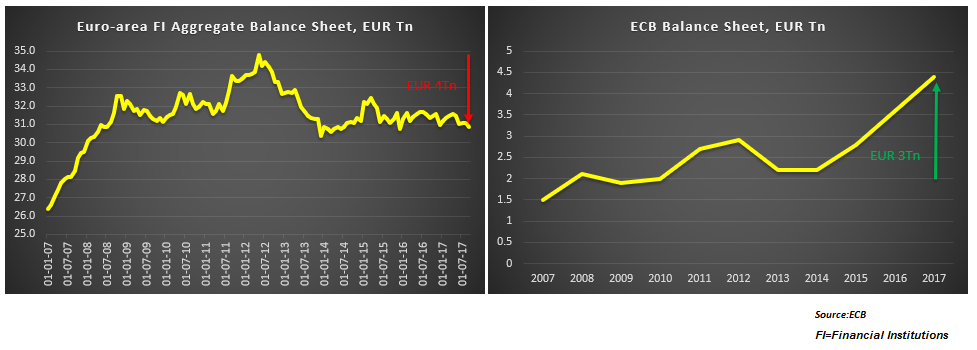
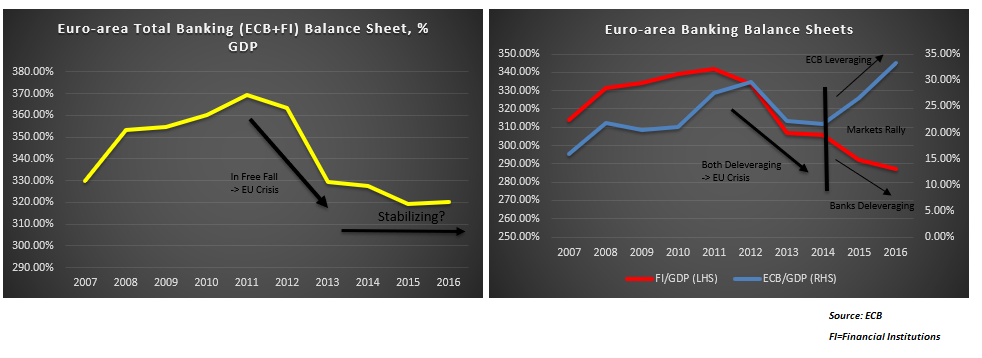
Financial institutions in the Euro-area started deleveraging after the sovereign crisis in 2012 and since then have shed about 4Tn EUR in assets (Left-panel chart below). The European Central Bank’s (ECB) balance sheet, on the other hand, has increased by about 3Tn since the 2008 financial crisis with the majority of the increase happening after 2014 (Right-panel chart below).
Indeed, between 2011 and 2014, both the banking system’s and ECB’s balance sheets had been decreasing relative to EU-area GDP – a fact which substantially contributed to the prolonged negative effect of the sovereign crisis and kept European assets underperforming (Right-panel chart below). Since 2014, however, while the banking system balance sheets continued to decrease, the ECB balance sheet started to rise relative to GDP.
As a result of that, the total balance sheet (ECB + financial institutions) has started to stabilize at these levels (Left-panel chart above). Nevertheless, it seems that the ECB is indeed repeating the BOJ error of taking its time to raise its balance sheet to support the deleveraging happening in the banking system. If that deleveraging continues, as is more likely than not on the back of continued regulation (Dodd-Frank, Basel III) and the pressure form fintech and now cryptocurrencies, the ECB will most likely also have to massively increase its purchases by adding private assets to the list, just like BOJ.
US
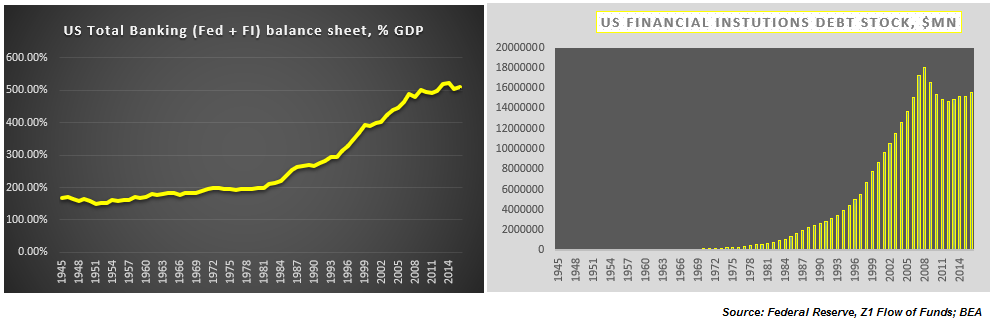
US total banking system assets (Fed + financial institutions) are unchanged since the 2008 financial crisis (Left-panel chart below). Even though, the financial system has indeed deleveraged by the order of $3Tn (Right-panel chart below), the Fed has made up by leveraging its balance sheet by about the same amount. In fact, this is the first time since WW2 when banks in the US have deleveraged.
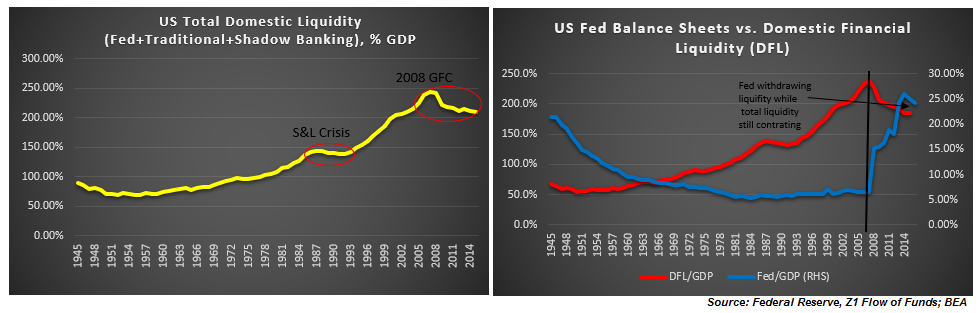
However, most of the liquidity in the system since the mid-1990s has been generated in the shadow banking system (see here, for example). Therefore, for the US, I have compared the central bank’s balance sheet to total domestic liquidity (Charts below).
Total liquidity relative to GDP is still decreasing despite the efforts of the Fed to the contrary (Left-panel chart above). Except for the period between WW2 and 1957, there was only one other period when total domestic liquidity was decreasing – during the Savings and Loan crisis in the late 1980s.
Fed’s liquidity is now starting to slow down as well. This is a big risk if the banking system also continues to deleverage (Right-panel chart above).
Conclusion
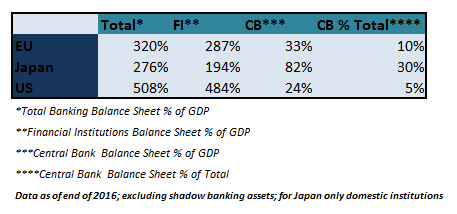
BOJ, ECB, Fed balance sheets are much bigger relative to GDP and relative to where they were before the crisis on absolute levels, but relative to the total balance sheet of the financial system they are still quite small. If the ‘private’ banks continue to deleverage, the central banks’ share of the total balance sheet will continue to naturally rise even if they do not increase their balance sheet. The overall financial system will shrink as a result. However, the risk to the financial system is much bigger if the central banks also deleverage at the same time.
Martin Walker (FT Alphaville) touches upon an important aspect of the modern crypto money creation process: the ridiculous costs and unnecessary side effects of digital ‘mining’.
Bitcoin exemplifies our bizarre relationship with money through the ages stemming from our lack of understanding of what it is. It’s as if we are cursed to never come to terms with money’s functions and how they help us progress. Our problems started with us prioritizing the ‘store of value’ of value function of money over ‘medium of exchange’ and ‘unit of account’. For if money is expected to increase in value, it is much more likely to be hoarded than exchanged and thus it will eventually cease to be a reliable unit of account.
From there on, it all went downhill for different reasons: huge, cumbersome stones; other stupid object; precious metals… There were some interruptions to this craziness: the time of the Roman republic, the first fiat money in China, the Italian city states creating the first modern ledger during the Renaissance. But generally speaking the crazy money mist always came back and deluded us in going to extremes (mining foreign lands, killing indigenous people, etc.) to obtain shiny objects and call them money.
Until it all ended in 1971 when Nixon pulled the US out of the Bretton Woods Agreement and fiat money became the norm globally. And now, in 2017, having reached an extraordinary level of human progress, once again the mist is descending in front of our eyes and we are thinking about going back to ‘mining’ for money?
“All the perplexities, confusion, and distress in America arise…from downright ignorance of the nature of coin, credit and circulation” John Adams in a letter toThomas Jefferson
1)We should have never ‘put together’ “store of value” and “medium of exchange”.
2) If something has intrinsic value which is expected to go up in time, it will be hoarded and exchanged less often.
3)’Money’ is a “unit of account” which we ‘exchange’, in order to efficiently get the things we really need and want in life.
4)Inflation/Deflation are simply measures of whether ‘money’ is abundant or scarce relative to the economic activity we desire.
5)In the economic system we have created, purchasing power is gained either through paid work or through credit.
7)As long as companies earn a profit, they retain more ‘money’ than they distribute in wages and other payments, thus there is insufficient medium of exchange to meet the supply of goods.
7)Even if companies invest the profit in new projects, this only adds to the previous supply-demand imbalance unless new medium of exchange is added endogenously in the form of credit.
8)Advances in technology make the old paradigm of Work=Job=Income obsolete; purchasing power is lost.
9)Credit only makes the scarcity of ‘money’ more acute because new medium of exchange needs to be added just to pay the interest on the debt; a vicious cycle develops.
10)This credit/debt cycle also eventually comes to a natural end (2008); no more purchasing power can be added even endogenously.
11)If we want to keep the current economic system going, we need to find a new way of generating ‘purchasing power’.
12)But if the paradigm has shifted, normalization is meaningless; instead of going back to something that does not work, let’s look forward.
12)’Helicopter money’ has an, unjustifiably, bad reputation historically.
13)UBI is politically unfeasible to implement in a large country with open borders.
14)The problem with them in the past has been our lack of knowledge of existing economic activity, and thus our inability to disburse the right amount of purchasing power needed.
15)M≠PxT, so we invent V, in order to MxV=PxT
16) Both of them, however, are great ideas which need to be put in the context of our existing institutional framework.
17)The central bank opening its balance sheet (CBDC) to the public at large is the next step in monetary/fiscal policy.
18)Blockchain, as in a large, open, decentralized, distributed, real-time database of all economic transactions, is the digital equivalent of ‘GDP’ of the industrial era.
19)The Fisher’s equation above then takes the form of CBDC=Blockchain, ‘money’ matches economic activity.
I would not be blindfolded by the fact that the US is trying to go back to ‘normal’ with the Fed on a rate-raising spree. ‘Normal’ changed a long time before 2008. You cannot go back to ‘normal’ with a broken monetary transmission mechanism. We can create all the money in the world but if it goes in the hands of the few, if it is subsequently ‘hoarded’ and if it cannot reach the end consumer because Work≠Job≠Income (whether that is because of technology, globalization or whatever) or because the credit channel is closed (the end of the private debt super-cycle in 2008), the economy is not going to go anywhere. And if there is little demand because there are not enough mediums of exchange, aka money, circulating in the economy, optimizing production is a waste of time and resources.
Instead of focusing on going back to a ‘normal’ interest rate policy, a forward-looking central bank would be looking into the opportunity presented by the rise of the blockchain technology and the subsequent spread of digital cryptocurrencies. The latter are a direct response to the broken down monetary transmission mechanism: if the traditional mediums of exchange do not circulate in the economy, people are devising their own ways of exchanging goods and services.
The interest-rate cycle is something of the past now. If the financial crisis of 2008 did not make it obvious, perhaps, we have to wait for the next one, which would be here like clockwork as policy makers embark on the policy of ‘normalization’. But there is some hope that some central banks are looking into ways to introduce a digital currency of their own and opening their balance sheet to the public at large.
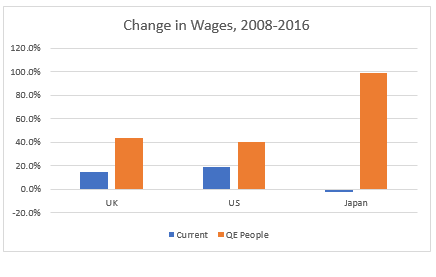
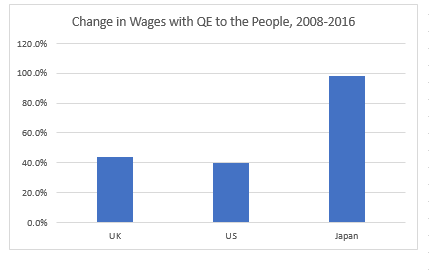
Back of the envelope calculation shows that if the money spent on buying financial assets by the central banks of UK, US and Japan, was instead disbursed directly to the people, working wages would have risen substantially.
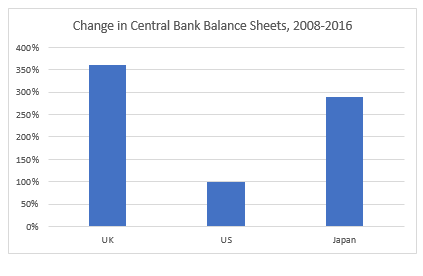
Between 2008 and 2016, central banks’ balance sheets have risen by 360% in the UK, 99% in the US and 280% in Japan.
Source: Bank of England, US Federal Reserve, Bank of Japan
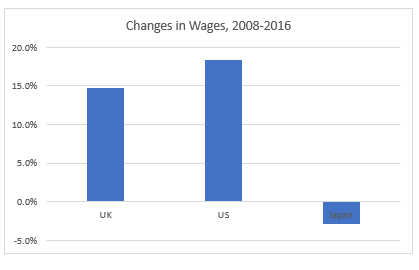
At the same time, over this period, nominal wages have risen by only 14.8% in the UK, 18.4% in the US and actually fallen by 2.9% in Japan! In 2016, the average annual wage in the UK was GBP 34,142, in the US – USD 60,154 and in Japan – Yen 4,425,380.
Source: OECD
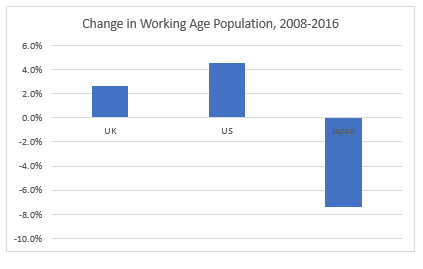
Japan is peculiar also because its working age population declined by 7.4%, while US’ and UK’s rose by 4.5% and 2.7%, respectively, during this period.
Source: OECD
I took the actual change in central bank balance sheets and divided it over the average working age population between 2008 and 2016. If this money could have been disbursed directly to the people, workers would have received a lump sum of GBP8,574, USD10,997, Yen4,430,424 over the period.
Let’s imagine that this lump sum was disbursed to the working age population at the end of 2016. Compared to 2008, their wages in 2016 would then have been higher by 44% (UK), 40% (US), 98% (Japan)!
If wages could indeed ‘miraculously’ rise by almost half in the UK and US and almost double in Japan over this 8 year period, what are the chances that we would still be stuck around 2% inflation in the US and UK and around 0% in Japan? Where would GDP be?
This is a very simple exercise. Undoubtedly real life is much more complicated that this and it is rarely black and white. Moreover, this would have been a lump sum disbursement, a one-off boost to income, and not a permanent rise in wages. Consumer behavior in this case, Ricardian equivalence, etc., would have been very different from a situation with a permanent rise in wages.
However, instead of patting ourselves on the back that things could have been much worse had the central banks not backstopped the financial system by buying financial assets, can we not also think how they could have also been much better if we found a better use for the money miraculously created out of thin air? If we could create money out of thin air to boost financial asset prices, is it really not possible to devise a way whereby the consumer also gets a permanent rise in income? Can we have an adult conversation about the effects of such an experiment without resorting to the taboos of the past? Can we include people other than economists in this conversation?
The free market may be the best and most efficient optimization model available so far to us, but what if we are optimizing the wrong variable?
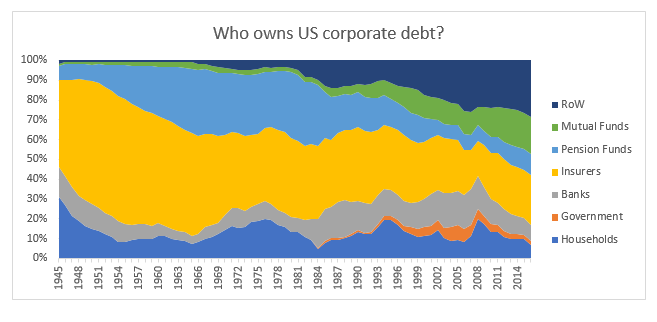
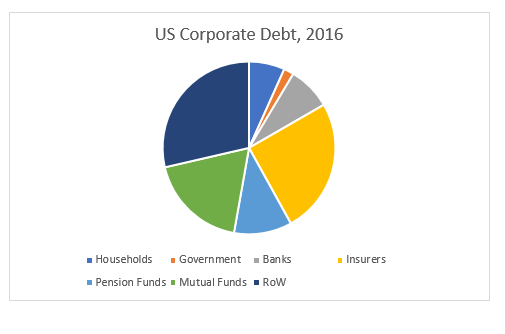
The largest holders of US corporate debt are foreign entities at 28.6% of all holdings. That’s up from less than 1% in the late 1940s.
The second largest holders are insurance companies at 25%. Even though their holdings have gone down from 44% in the 1940s, when they were also the largest holder by far, insurance companies seem to continue to play a dominant role in the US corporate debt market unlike so in equities or UST.
Mutual funds and pension funds come after at 18.6% and 10.8% respectively. Their roles have diverged since the mid-1980s with mutual funds relatively increasing, while pension funds relatively decreasing their holdings of US corporate debt.
Households were the second largest holder of US corporate debt in the 1940s at 31%. Today they are one of the smaller holders at 6.7%.