Tags
The spill-over from the crypto debacle recently was pretty much non-existent in public markets, largely because risk-on positions were relatively low (see my previous note), but also because crypto itself, even at its peak ‘capitalization’, is rather small relative to the other monetary aggregates, and is rather low in the overall hierarchy of money. I have written extensively on crypto before, how it (doesn’t) fit in the monetary transmission mechanism because it resembles shadow money, and why it is therefore not the future of money.
Rather timely in that sense, the Financial Stability Board (FSB) released last week a new report on the state of the non-bank, aka shadow bank, financial intermediation. The report itself is not particularly interesting but I took it as an opportunity to have an update on how financial assets are distributed intra as well as inter-country.
Bottom line is that despite being at the epicentre of the 2008 financial crisis and all the subsequent regulations introduced after that to ‘curtail’ it, shadow banking is still growing, especially in Europe, and in general outside of the US. If one were looking for a systematic risk to the system, it is not crypto per se, and it is still shadow banking.
How is this going to play out? Very general, shadow banking comprises all financial institutions without access to the central bank, i.e., without the cover of a lender of last resort. So, yes, crypto falls under that umbrella. And yes, it is crypto, or rather the tech behind crypto, which would eventually usher the solution – central bank digital currency (CBDC) which would allow direct access to a central bank balance sheet for pretty much everyone.
But that is unlikely to happen immediately now (too much wokeness about ‘privacy and liberty’ which completely misses the point about CBDC): we might have to go through another crisis to force our hands.
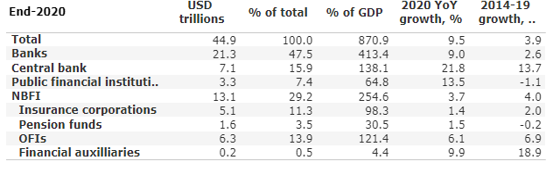
As of the end of 2020, there were $462.6Tn of financial assets globally. And this is how they were distributed:
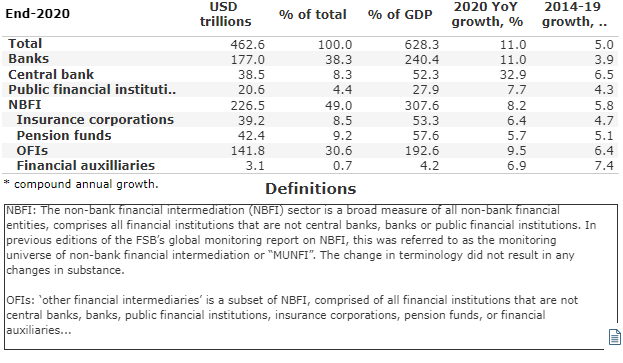
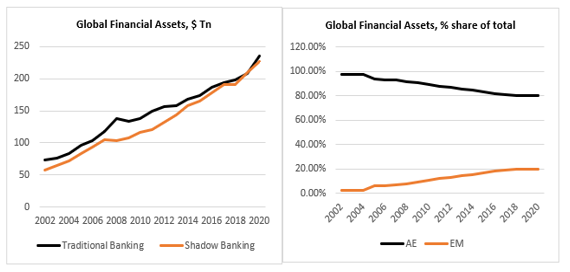
Roughly speaking, we can break column one into two subsections: traditional banking (Banks, Central bank, Public Financial Institutions) and shadow banking (Non-bank financial institutions=NBFI: Insurance corporations, Pension funds, OFIs=other financial institutions, Financial auxiliaries). As of 2020, the two comprised roughly a 50/50 split of the total with shadow banking catching up to traditional banking in the last few years (see the chart below, panel on the left).
Within traditional banking the share of bank financial assets is little changed over time (down marginally since 2002), but the share of central bank assets has grown substantially at the expense of public financial institutions. Within shadow banking, the share of OFI has grown substantially at the expense of pension funds and insurance companies.
How are total financial assets distributed inter-country? The chart above (panel on the right) shows the breakdown between Advanced Economies (AE) and Emerging Markets (EM): while in 2002 EM comprised just 2% of the total, in 2020, they were up to 20%!
Within AE, shadow banking now dominates, rising from 45% of the total in 2002 to 54% in 2020 (see the chart below, the panel on the left): it seems that QE has favoured a built-up of assets there. On the other hand, traditional banking is still very much dominant in EM even though its share has fallen over the years: shadow banking’s share has risen from 17% of the total to 27% (right-hand panel).

While central bank activity in financial markets has risen in AE, from 3% in 2002 to 8% in 2020, it has declined substantially in EM, from 43% in 2002 to 10% in 2020 (see the chart below, panel on the left). And while the social safety net (pension funds, insurance corporations) share of total financial assets has been fairly stable in AE around 20%, it has declined in EM from 12% in 2002 to 7% in 2020 (panel on the right).

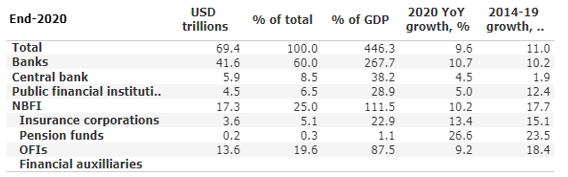
USA comprises a little more than a quarter of all global financial assets but one-third of the total shadow banking assets. The shares of traditional and shadow banking assets to total US financial assets are little changed over the years at 37% and 63% respectively. The share of the central bank financial assets has increased over the years from 2% to 6%.
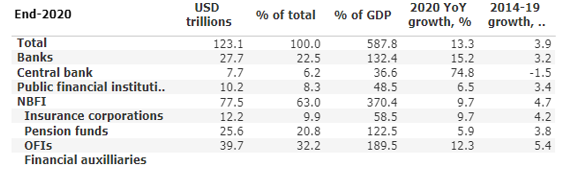
The Euro-area share of total financial assets is a bit less than a quarter of all global financial assets, but it has seen an explosion of shadow banking – its share of the total assets has risen from 20% to 51% since 2002. The share of the central bank financial assets has increased over the years from 4% to 12%.

Financial assets in Japan are about 10% of total global financial assets. Shadow banking in Japan is about 30% of the total financial assets in the country – and it has been fairly stable over the years. The share of the central bank financial assets has risen from 4% in 2002 to 16% in 2020.
China overtook Japan as the third largest global centre for financial assets in 2013 and currently it comprises about 15% of all global financial assets. Shadow banking in China has risen from 4% in 2005 (that’s when proper data becomes available for China) to 25% in 2020 but it is still below the ones in the other major financial centres. China bucks the trend whereby its central bank assets as a share of total have fallen from 22% in 2005 to 9% in 2020. The social safety net in China is pretty much non-existent – there is no pension funds industry, for all intends and purposes, while the insurance corporations’ share of financial assets has barely moved, risen from 4% to 5% since 2007!