
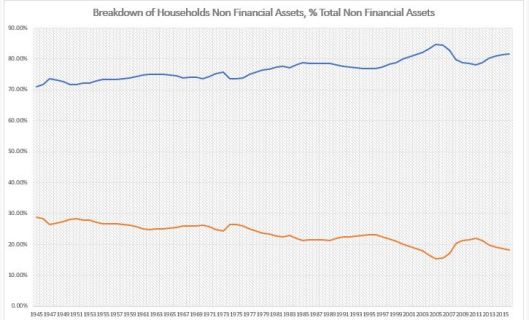
-US households balance sheet is comprised roughly of 70% financial assets and 30% real assets. That mixture has actually been relatively stable throughout the post WW2 period.

-The non financial side of the balance sheet is comprised of 80% real estate and 20% ‘goods’ (car, furniture, etc.). Since WW2 there has been a gradual increase in the real estate portion from 70% of total to about 85% in 2007.
-The biggest item on the financial side of the portfolio is the pension fund (PF) allocation at around 30% of total. This was not always the case. In fact, it has gradually grown from 9% in 1945.
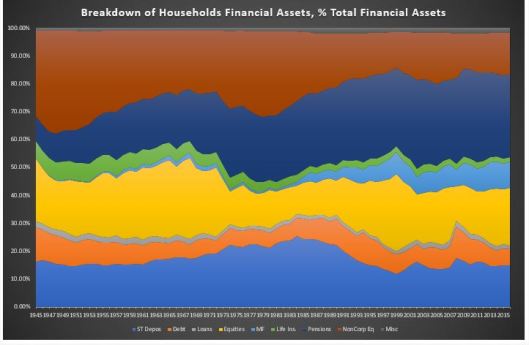
-The second biggest allocation is to equities (EQ) direct at around 18%, which turns out to be the average for the whole period post WW2. The highest allocation was in 1999 and 1965 at 28%, the lowest in 1984 at 10%. Households own equities also indirect through their pension and mutual funds.
-The third biggest allocation is cash at 15%, 17% being the average in the post WW2 period, 25% the highest in 1984, and 12% the smallest in 1999.
-The fourth largest allocation is to mutual funds (MF) at 9%. Just like with PF, this allocation has increased gradually from pretty much 0% before the financial liberalization of the early 1980s.
-Fixed Income (FI) direct only comes fifth here at 6%, average 7%, highest 11% in 2008, smallest 5% in 1972. Households also own fixed income indirectly through their pension funds.
-The FI portfolio is comprised of USTs, agencies, munis and corporate debt. Munis have the largest allocation at around 39% followed by USTs at 33% corporates at 19% and agencies.
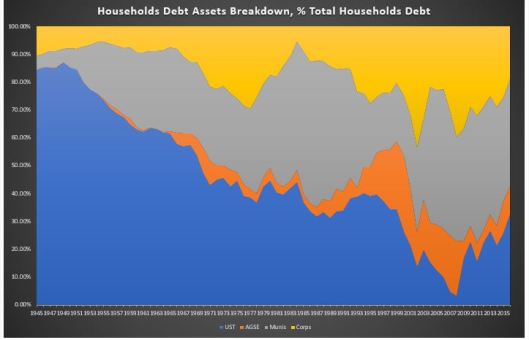
-the FI portfolio looked very different in the early days with the bulk of the exposure in USTs (84%), corporates (11%) and munis (5%). Agencies exposure kicked in only in the late 1960s.
-US households also own their own businesses (non-corporate equity – NCEQ) which used to be their largest exposure immediately in the early days post WW2 at 31% but has gradually halved by now.
-If we add cash and loans (very small exposure) to FI, the FI allocation overall goes to 23%. If we add the MF exposure to the Equities exposure, the latter goes to 27%. Life insurance (LI) and ‘Other’ comprise the remaining 5%.
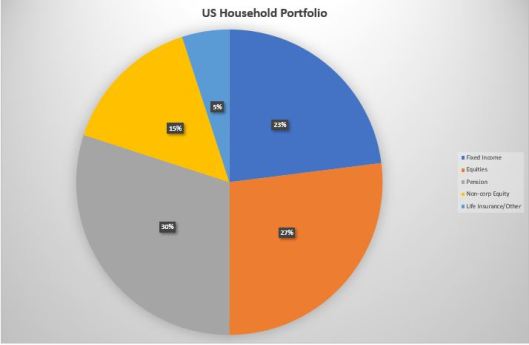
-If we extract the PF exposure to its respective allocation to the different asset classes, the overall ‘concise’ US household portfolio has these weights at the moment: FI-30%, EQ-40%, NCEQ – 15%, LI/Other – 15%.

