Answer: Depends on the size of the overall financial system balance sheet and whether it is deleveraging/leveraging.
This is a follow up on a previous post addressing the rationale for a continued increase of the major central banks’ balance sheet barring a sudden rise in the ‘private’ banks’ balance sheets.
Summary: We have been used to a small and relatively stable central bank balance sheet because before the 2008 financial crisis, the banking system balance sheet had been steadily growing. However, post the crisis, the banking system started deleveraging across the developed world. To avoid a continuation of the financial crisis, the central banks there had no choice but to leverage, i.e. increase their balance sheet.
Going forward, the size of the central bank balance sheet will be very much determined by what happens with the banking system balance sheet as a whole: if banks continue with the deleveraging, something which is more than likely given the plethora of financial regulations (Dodd-Frank, Basel III, MIFID2, FATCA, AMLD, AIFMD, CRS, etc.), the central bank may have to continue to expand its balance sheet or face another financial crisis.
Background
Since the 2008 financial crisis, to most economic observers, central banks have been increasing their balance sheets in order to facilitate easier economic conditions having exhausted their conventional means to do so. There is a strong debate among economists, investors and market practitioners, in general, about the effectiveness of such policies. I argue that the direct economic issues (growth, inflation) may have been of secondary importance to the reasoning behind the increased central bank balance sheets.
Central bankers’ primary objective may have been financial stability, including maintaining a stable rate of growth of the country’s total financial balance sheet. In that sense, some central banks’ balance sheet may need to grow even larger if the ‘private’ banking sector continues to deleverage.
On one hand, central banks’ balance sheets are unique in the sense that they act as the lender of last resort: they control, and, to a certain extent, regulate the money supply. That’s the conventional view of central banks. On the other hand, they are an integral part of the country’s financial sector, and, therefore, cannot be viewed in isolation.
The ‘private’ and central banks’ balance sheets are indeed linked together. We have been used to the former generally rising, especially so after the great financialization of the economy beginning in the 1980s. Therefore, we have taken it for granted that the central bank needs to just ‘sit back and relax’: there was no need for it to do any heavy lifting, i.e. the central bank’s balance sheet did not need to rise relative to GDP or to the whole financial sector’s balance sheet.
Since 2008, however, we have seen the private banking system heavily deleveraging in the US and EU. In Japan, the deleveraging actually started in the mid-1990s when the ‘private’ banking system’s balance sheet started shrinking relative to GDP. In order to maintain financial stability, the central banks in these respective countries needed to start to increase their balance sheet at a much faster pace than GDP and, more importantly, than the rate of deleveraging of the ‘private’ banking sector.
Japan
Even though it started properly leveraging (QE) only in the early 2000s, the Bank of Japan (BOJ)’s balance sheet started growing relative to GDP at the same time the domestic commercial banks’ balance sheet started deleveraging in the mid-1990s (see the chart on the right hand-side of the panel below). Nevertheless, the total financial system balance sheet (BOJ + the commercial banks) continued to decline between 1995 and 2007 (see the chart on the left-hand side of the panel below). The BOJ should have expanded its balance sheet much more back then.
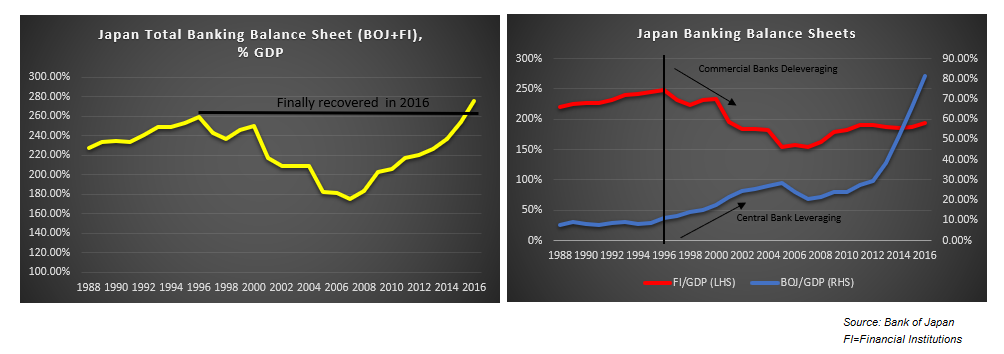
Ironically, it was after the 2008 GFC that the domestic commercial banks’ balance sheet in Japan started growing again in line with also the BOJ’s balance sheet. As a result, the total financial system balance sheet also started growing. However, it took until 2016 for it to reach its previous peak from the mid-1990s. That was mostly thanks to the BOJ heavily increasing its balance sheet by starting to buy also private assets – corporate bonds, REITs, equities.
EU
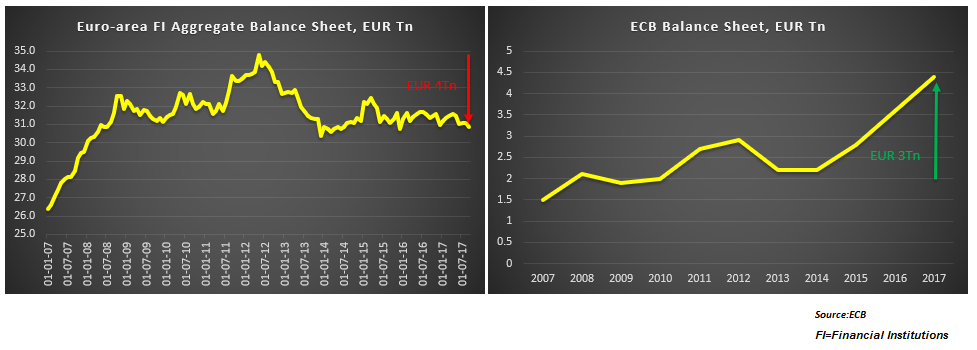
Financial institutions in the Euro-area started deleveraging after the sovereign crisis in 2012 and since then have shed about 4Tn EUR in assets (Left-panel chart below). The European Central Bank’s (ECB) balance sheet, on the other hand, has increased by about 3Tn since the 2008 financial crisis with the majority of the increase happening after 2014 (Right-panel chart below).
Indeed, between 2011 and 2014, both the banking system’s and ECB’s balance sheets had been decreasing relative to EU-area GDP – a fact which substantially contributed to the prolonged negative effect of the sovereign crisis and kept European assets underperforming (Right-panel chart below). Since 2014, however, while the banking system balance sheets continued to decrease, the ECB balance sheet started to rise relative to GDP.
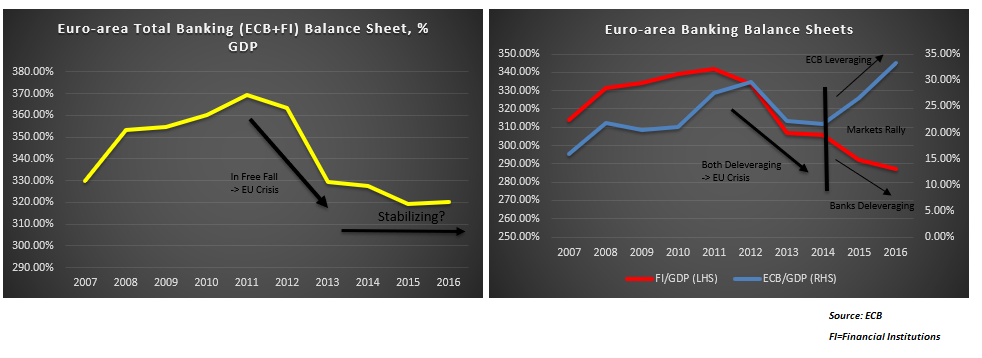
As a result of that, the total balance sheet (ECB + financial institutions) has started to stabilize at these levels (Left-panel chart above). Nevertheless, it seems that the ECB is indeed repeating the BOJ error of taking its time to raise its balance sheet to support the deleveraging happening in the banking system. If that deleveraging continues, as is more likely than not on the back of continued regulation (Dodd-Frank, Basel III) and the pressure form fintech and now cryptocurrencies, the ECB will most likely also have to massively increase its purchases by adding private assets to the list, just like BOJ.
US
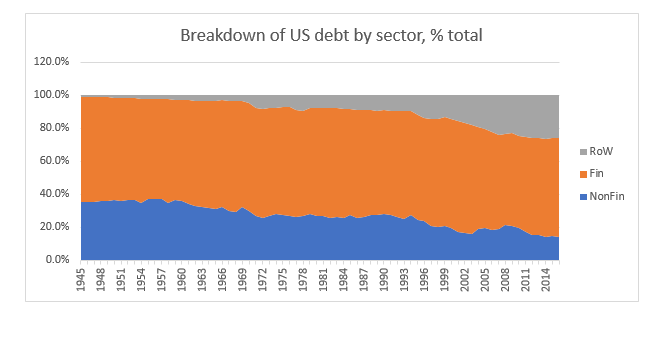
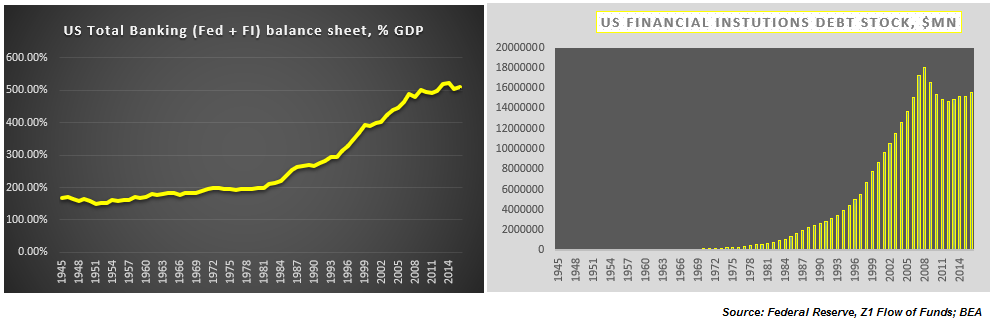
US total banking system assets (Fed + financial institutions) are unchanged since the 2008 financial crisis (Left-panel chart below). Even though, the financial system has indeed deleveraged by the order of $3Tn (Right-panel chart below), the Fed has made up by leveraging its balance sheet by about the same amount. In fact, this is the first time since WW2 when banks in the US have deleveraged.
However, most of the liquidity in the system since the mid-1990s has been generated in the shadow banking system (see here, for example). Therefore, for the US, I have compared the central bank’s balance sheet to total domestic liquidity (Charts below).
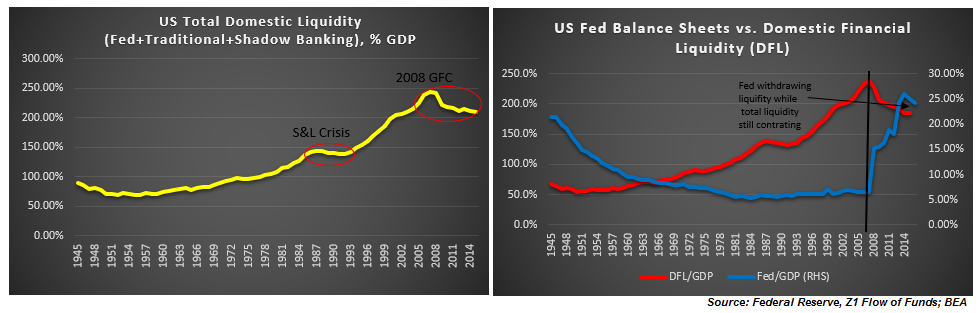
Total liquidity relative to GDP is still decreasing despite the efforts of the Fed to the contrary (Left-panel chart above). Except for the period between WW2 and 1957, there was only one other period when total domestic liquidity was decreasing – during the Savings and Loan crisis in the late 1980s.
Fed’s liquidity is now starting to slow down as well. This is a big risk if the banking system also continues to deleverage (Right-panel chart above).
Conclusion
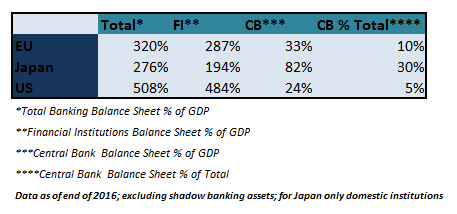
BOJ, ECB, Fed balance sheets are much bigger relative to GDP and relative to where they were before the crisis on absolute levels, but relative to the total balance sheet of the financial system they are still quite small. If the ‘private’ banks continue to deleverage, the central banks’ share of the total balance sheet will continue to naturally rise even if they do not increase their balance sheet. The overall financial system will shrink as a result. However, the risk to the financial system is much bigger if the central banks also deleverage at the same time.