Liquidity is getting tighter. The decline in Fed repos is simply a reflection of their increased cost. Therefore, we will know when things are really getting bad if repo volumes start to pick up. Finally, if the market expected to get a flush of liquidity towards month end from TGA, this is now less likely to happen.
First drop in overall Fed’s balance sheet since 02/26. And it is a rather large drop, $74Bn.
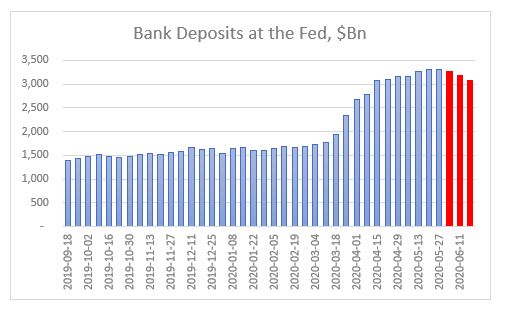
Third week in a row of declines in bank deposits. Level now is the same as 04/15. The 4-week rolling growth rate is now the lowest since the Fed’s U-turn last September.
TGA continues to climb to record highs despite some disbursements towards Fed’s SPVs as new programs get triggered. It is likely that the level of TGA depends on the amount of SBA loans drawn/forgiven and such TGA can stay above $800Bn, Treasury’s target, for some time.
CB swap lines decline by $92Bn – first large decline as some of them have matured and no additional USD funding required.
Net repos outstanding continue to decline – this has been a feature all of this week as both O/N and term repos have been 0 for USTs. Reason for that is Fed raised the minimum bid on O/N to IOER +5bps and on term to IOER +10bps. This was a surprise, not that it happened (Fed probably made that decision at its April FOMC already), but that it happened ahead of tax receipts day. Commercial banks now must step in to fill in the gap but with their deposits on decline, their flexibility is diminished.
Fed bought $83Bn of mortgages – that’s perhaps to compensate for net selling in the previous 3 weeks.
Extra liquidity is getting withdrawn. That’s it. Market is not in distress yet. For that, we will know it when Fed repo volumes start picking up again and O/N rates shoot up. But for sure, on the margin, there is less liquidity to go around. Markets are not reflecting this yet. Perhaps, waiting for a sign, that all this surplus liquidity has been withdrawn, to react.
According to John Authers at Bloomberg, data from CrossBorder Capital, going back to January 1969, shows that we have been recently experiencing Fed’s greatest liquidity boost ever. I have no reason to doubt CrossBorder Capital or their proprietary model of measuring liquidity. But there are many ways of defining, as well as measuring, liquidity. So, I decided to simply look at what exactly the Fed has done since it started expanding its balance sheet in September last year.
Source: FRB H41, beyondoverton
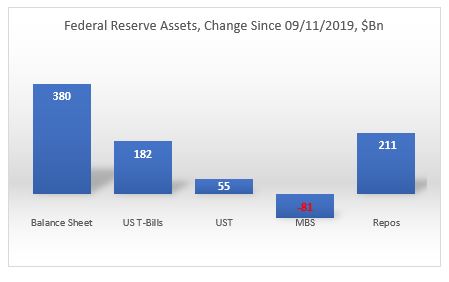
Fed has indeed been doing more than $100Bn worth of repo operations on a daily basis recently, but those operations are only temporary, i.e. they can not be taken cumulatively in ascertaining the effect on liquidity. In fact, the Fed’s balance sheet has increased by $380Bn, and only 55% of which came from O/N and term repo operations ($211Bn). The other 45% came from asset purchases. On the asset purchases, the Fed bought mostly T-Bills ($182Bn), some coupons ($55Bn) while letting its MBS portfolio slowly mature (-$81Bn).
However, not all of that increase went towards interbank liquidity. In fact, only about 50% of that increase ($198Bn) went towards bank deposits. The TGA account increased by $167Bn; that drained liquidity. Reverse repos decreased by $20Bn (FRP by $17Bn and others by $3Bn), which added liquidity. Finally, $37Bn went towards the natural increase in currency in circulation.
Source: FRB H41, beyondoverton
Fed actually started increasing its T-Bill and UST portfolio already in mid-August, three weeks before the repo spike. Part of that increase went towards MBS maturities. But by the end of August, Fed’s balance sheet had already started growing. By the third week of September, also the combined assets portfolio (T-Bills, USTs, MBS) started growing as well, even though MBS continued to decrease on a net basis.
Source: FRB H41, beyondoverton
Fed’s repo operations started the second week of September. They reached a high of $256Bn in the last week of December. At the moment they are at the same level where they were in the first week of December ($211Bn).
Source: FRB H41, beyondoverton
On the liability side, the TGA account actually bottomed out two weeks before the Fed started buying USTs and T-Bills, while the FRP account topped the week the Fed started the repo operations. Could it be a coincidence? I don’t think so. My guess is that the Fed knew exactly what was going on and took precautions on time (we might find eventually if it did indeed nudge foreigners to start moving funds away from FRP).
Source: FRB H41, beyondoverton
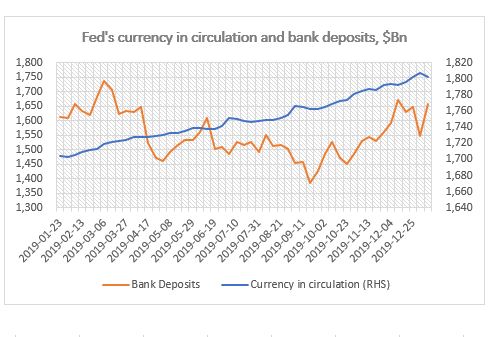
Finally, while currency in circulation naturally increases with time, bank deposits also bottomed out the week the Fed started the repo operations in September, but strangely enough, they topped the first week of December (for the time being).
Source: FRB H41, beyondoverton
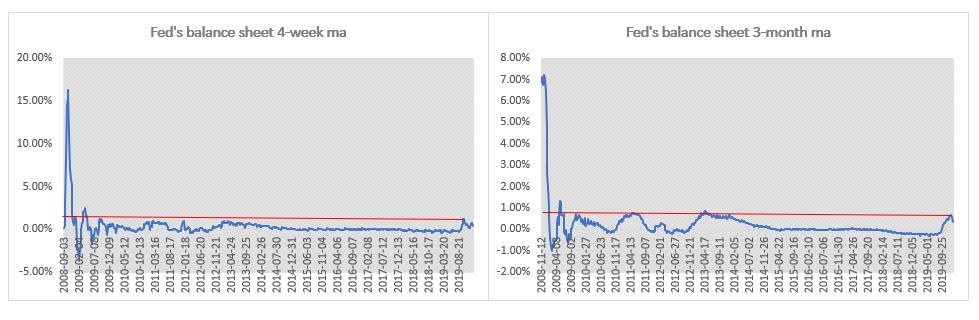
So, while the Fed’s liquidity injection since last September was substantial relative to both the decrease in liquidity before that (starting in 2018 when the decrease in the Fed’s balance sheet became consistent) and, to a certain extent, since the end of the 2008 financial crisis, it is difficult to make a claim that this is the greatest liquidity boost ever. The charts below show the 4-week and 3-month moving average percentage change in the Fed’s balance sheet. The 4-week change in September was indeed the largest boost in liquidity since the immediate aftermath of the 2008 financial crisis. The 3-month change though isn’t.
Source: FRB H41, beyondoverton
The Fed pumped more liquidity in the system during the European debt crisis. In the first four months of 2013, not only the growth rate of the Fed’s balance sheet was higher than in the last four months now since September 2019, but also the absolute increase in Fed’s assets and US bank deposits. Moreover, there were no equivalent increases in either the TGA or the FRP accounts.
Final note, if the first week of January is any guide, it might be that a big chunk of the Fed’s balance sheet increase might be behind us, if only for the time being. Fed’s balance sheet decreased by $24Bn, which is the largest absolute decrease since the last week of July 2019, i.e. before the start of the most recent boost in liquidity. I actually do expect the Fed’s balance sheet to keep growing but at a much smaller scale and mostly through asset purchases rather than repos.