
Summary
- Even though total US debt is up in nominal terms since the 2008 financial crisis ($54.7Tn vs $66.5Tn), total debt as a % of US GDP is down (368% vs 353%)
- It is the financial sector that has deleveraged both in nominal terms and as a % of US GDP ($18.2Tn vs $15.7Tn and 122% vs 83%, respectively)
- Of the nonfinancial sector private debt holders, households have deleveraged relative to GDP (97% vs 79%), while business have leveraged but only from 72% to 73%, even though both of their nominal debt levels have gone up ($14.3Tn vs $14.9Tn and $10.7Tn vs $13.7Tn).
- The public sector (federal and state government) has leveraged both in nominal terms (the overall debt levels have doubled from $9.8Tn to $18.9Tn) and relative to GDP (66% vs 84%)
- Households have reduced their mortgage debt from $10.7Tn to $9.8Tn, while increased their consumer credit debt from $2.6Tn to $3.8Tn
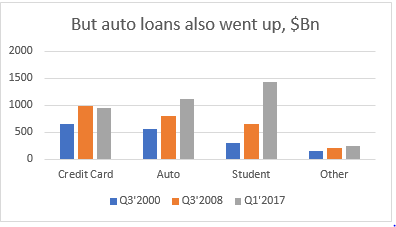
- Out of consumer credit, households reduced marginally their credit card debt ($983Bn vs $959Bn), increased their auto loans ($802Bn vs $1.1Tn) and more than doubled their student loans ($659Bn vs $1.4Tn)
- The media and some financial analysts are focusing on these latter increases in auto and student loans as a sign that households are increasingly leveraging again, however, the reality is that a large part of the increase in consumer credit debt is offset by the decrease in mortgage debt
- In addition, neither student (8% GDP) nor auto (6% GDP) – nor the two combined – have the systematical and strategic significance of mortgage debt which was the cause of the 2008 financial crisis (72% of GDP at the time)
Charts and details
There is a lot of confusion sometimes when it comes to analyzing debt. From a macro point of view there are two main distinctions: private (household and businesses) vs public (sovereign) and domestic (denominated in the sovereign currency) vs foreign (foreign currency). The distinction above is important because for a fully sovereign country it is the private and foreign debt that one should be really concerned about.
The public sovereign debt can always be repaid because the sovereign can print the currency at will, even though in extreme cases that may mean currency devaluation and possibly hyperinflation. The private domestic borrowers have no choice but to find means of acquiring the legal tender to repay the debt. However, in some extreme cases, as in during the 2008 financial crisis, the sovereign can choose to bail the private sector out (the financial sector in this case) by resorting to creating currency ‘ex nihilo’.
Neither public nor private foreign borrowers (i.e. entities which have borrowed foreign currency) can resort to such privilege and, just like the private domestic sector, have to find means to obtain the foreign currency to repay their debt. Again, sometimes in extreme cases, as in during the Greek crisis, international institutions can choose to bail out the sovereign foreign borrower. This normally happens after the sovereign foreign borrower has first bailed out a private foreign borrower in their own country (as it happened for the financial sector in Portugal, Ireland and Greece during the European sovereign crisis).
Here I focus on US domestic nonfinancial debt, i.e. both public as well as private but denominated in the sovereign legal tender. Here is a big picture view of that debt:
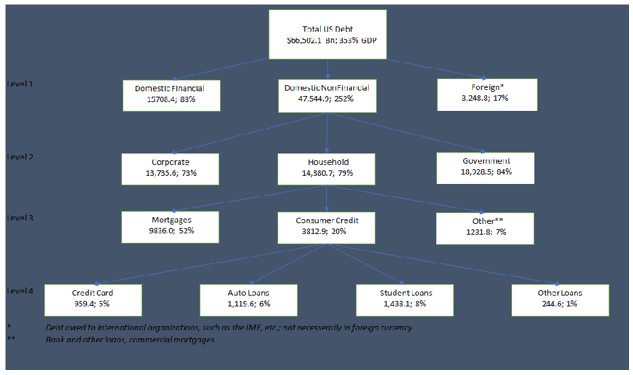
(Click to enlarge for a better view)
The numbers above are the latest available (Q1, 2017) from the US Fed Z1 Flow of Funds Report. All the data in this note are sourced from the above report. In the analysis below, which uses the above diagram as a basis, I have chosen to look at the relevant debt levels now as well as just before the 2008 and 2000 US crises.
Level 1 Analysis:
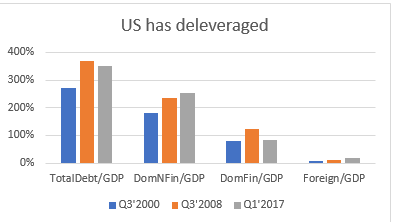
Relative to GDP, the US has deleveraged, even though the domestic non-financial sector has continued to leverage.
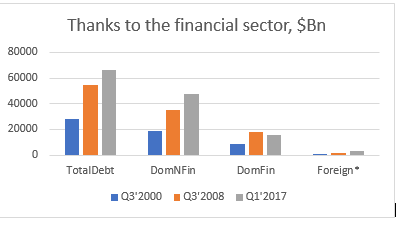
However, the US financial sector has deleveraged in nominal terms as well, which is quite extraordinary indeed.
Level 2 Analysis:
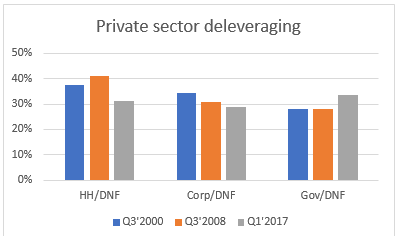
Here we drill down the US domestic non-financial sector debt. Relative to the overall domestic non-financial sector total debt, both households and the corporate sector have deleveraged.
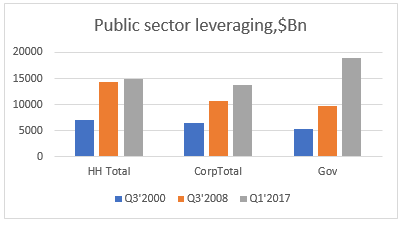
It is the government (mostly the federal government) which has continued to leverage. Public sector debt has more than doubled since 2008 and almost quadrupled since 2000. But as per the above, even though the increase of public sector debt is an issue (see Japan), it is not a systematic issue (again, see Japan). Our concern is drilling further into the private debt story, more specifically the household sector.
Level 3 Analysis:
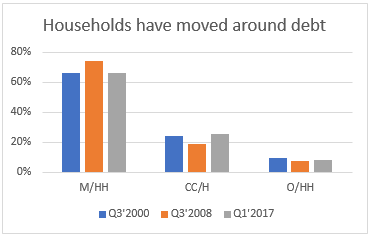
Mortgage debt as a % of overall household debt has decreased at the expense of consumer credit. The polar opposite of what happened between the 2000 and 2008 crises.
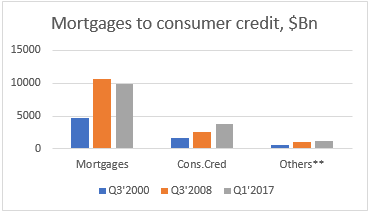
But in nominal terms, between 2000 and 2008, both mortgage debt and consumer credit debt increased (and mortgage debt more than doubled from $4.7Tn to $10.7Tn). That is why the 2008 financial crisis was so massive. Still, what is causing the increase of consumer credit debt?
Level 4 Analysis:
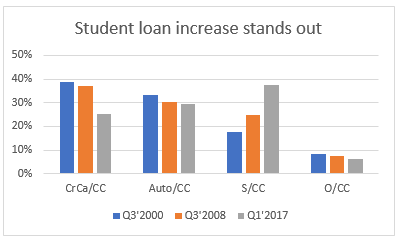
It seems out that the media, etc. does have a reason to focus on the ‘extraordinary’ rise in student loans, especially when they hit, and surpassed, the trillion dollar mark. Relative to overall household consumer credit, student loan is the only item which has increased.
In nominal terms, auto loans also surpassed the trillion dollar mark, but it is nevertheless the sheer increase in student loans which has captured the attention. Perhaps, there is much more to the student loan story than the financial implications. There is also the moral/emotional side of the fact that the cost of education has increased disproportionally to what it can offer in terms of advantages in the job market in the age of the sophisticated machine. While it is still true that a person with a higher education would generally fair better professionally, there must be a heavy discount to the fact that this person would have to also pay down the student debt which he/she acquired in the process. Once we draw the line, who is better off?
There is no doubt though that there is little in the above numbers to be concerned from a systematic point of view. At least relative to previous financial crises. A collapse of the student loan market would certainly affect consumer confidence and economic growth but it is unlikely to have the same catastrophic effect as the mortgage crisis of 2008.

Pingback: Not all debt is created equal | BeyondOverton